
Page 38 - Planning and Design of Airports
P. 38
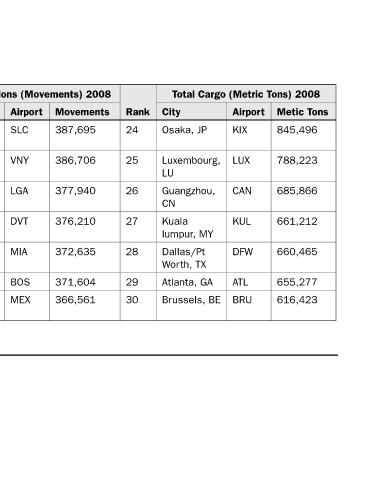
Metic Tons
                  Total Cargo (Metric Tons) 2008  Airport  KIX  LUX  CAN  KUL  DFW  ATL  BRU
                             788,223
                        845,496
                                   685,866
                                                  655,277
                                             660,465
                                        661,212
                                                     616,423


                     City  Osaka, JP  Luxembourg,   LU  Guangzhou,   CN  Kuala   lumpur, MY  Dallas/Pt   Worth, TX  Atlanta, GA  Brussels, BE

                     Rank  24  25  26   27   28   29  30


                  Total Operations (Movements) 2008  Movements  Airport  387,695  SLC  386,706  VNY  377,940  LGA  376,210  DVT  372,635  MIA  371,604  BOS  366,561  MEX


                     Rank  City  Salt Lake   24 35,144,841  City, UT  Los Angeles,   25 35,132,879  CA  New York, NY  26 34,732,584  Phoenix, AZ   27 34,530,593  Miami, FL  28 34,214,474  Boston, MA  29 34,063,531  Mexico City,   30 34,032,710  MX


                  Total Passenger Traffic 2008  Passengers  Airport  DTW  FCO  CLT  MUC  LGW  MIA  MSP  The World’s Busiest Airports (Continued)


                     City  Detroit, MI  Rome, IT  Charlotte, NC  Munich, DE  London, GB  Miami, FL  Minneapolis/  St Paul, MN   Source: Airports Council International.


                     Rank  24  25  26   27   28   29  30        TABLE 1-6