
Page 411 - Planning and Design of Airports
P. 411
356 Airp o r t D e sign
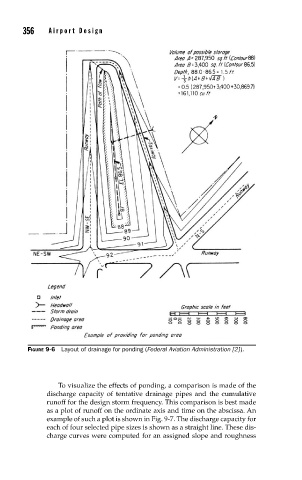
FIGURE 9-6 Layout of drainage for ponding (Federal Aviation Administration [2] ).
To visualize the effects of ponding, a comparison is made of the
discharge capacity of tentative drainage pipes and the cumulative
runoff for the design storm frequency. This comparison is best made
as a plot of runoff on the ordinate axis and time on the abscissa. An
example of such a plot is shown in Fig. 9-7. The discharge capacity for
each of four selected pipe sizes is shown as a straight line. These dis-
charge curves were computed for an assigned slope and roughness