
Page 229 - Plant design and economics for chemical engineers
P. 229
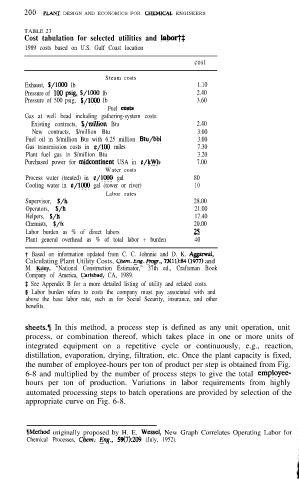
200  PLANT  DESIGN AND ECONOMICS FOR CHEMlCAL  ENGINEERS

       TABLE 23
       Cost tabulation for selected utilities and  labofi$
       1989 costs based on U.S. Gulf Coast location
                                                   cost

                            Steam costs
       Exhaust,  $/lOOO  lb                         1.10
       Pressure of  100  psig,  $/lOOO  lb          2.40
       Pressure of 500 psig, $/lOOO  lb             3.60
                             Fuel  costs
       Gas at well head including gathering-system costs:
         Existing contracts,  $/mi\\ion  Btu        2.40
         New contracts, $/million Btu               3.00
        Fuel oil in $/million Btu with 6.25 million Btu/bbl  3.00
        Gas transmission costs in g/l00  miles      7.30
        Plant fuel gas in $/million Btu             3.20
       Purchased power for  ntidcontinent  USA in $/kWh  7.00
                            Water costs
        Process water (treated) in e/l000  gal     80
        Cooling water in r/l000  gal (tower or river)  10
                            Labor rates
        Supervisor,  $/h                           28.00
        Operators,  S/h                            21.00
        Helpers,  $/h                              17.40
        Chemists,  $/h                             20.00
        Labor burden as % of direct labors         25
        Plant general overhead as % of total labor + burden  40
        t  Based on information updated from C. C. Johnnie and D. K.  Aggarwal,
        Calculating Plant Utility Costs, Chem.  Emg. Progr., 73(11):84 (1977) and
        M.  Kiley,  “National Construction Estimator,” 37th ed., Craftsman Book
        Company of America,  Carlsbad,  CA, 1989.
        $  See Appendix B for a more detailed listing of utility and related costs.
        B  Labor burden refers to costs the company must pay associated with and
        above the base labor rate, such as for Social Security, insurance, and other
        benefits.

        sheets.ll  In this method, a process step is defined as any unit operation, unit
        process, or combination thereof, which takes place in one or more units of
        integrated equipment on a repetitive cycle or continuously, e.g., reaction,
        distillation, evaporation, drying, filtration, etc. Once the plant capacity is fixed,
        the number of employee-hours per ton of product per step is obtained from Fig.
        6-8 and multiplied by the number of process steps to give the total employee-
        hours per ton of production. Variations in labor requirements from highly
        automated processing steps to batch operations are provided by selection of the
        appropriate curve on Fig. 6-8.


        llMethod  originally proposed by H. E. Wessel,  New Graph Correlates Operating Labor for
        Chemical Processes,  Chem.   Eng.,   59(7):209  (July, 1952).