
Page 230 - Plant design and economics for chemical engineers
P. 230
COST ESTIMATION 201
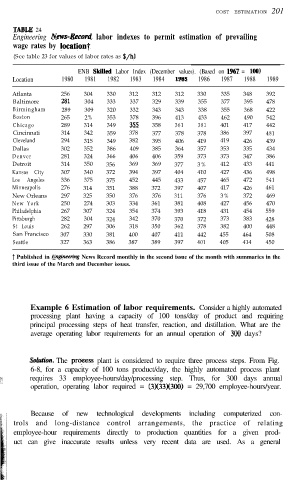
TABLE 24
Engineering News-Reconi labor indexes to permit estimation of prevailing
wage rates by locationt
(See table 23 for values of labor rates as S/h)
ENB Skikd Labor Index (December values). (Based on 1967 = 100)
Location 1980 1981 1982 1983 1984 1985 1986 1987 1988 1989
Atlanta 256 304 330 312 312 312 330 335 348 392
Baltimore 281 304 333 337 329 339 355 377 395 478
Birmingham 289 309 320 332 343 343 338 355 368 422
Boston 265 2% 353 378 396 413 433 462 490 542
Chicago 289 314 349 35.5 358 361 381 401 417 442
Cincinnati 314 342 359 378 377 378 378 386 397 481
Cleveland 294 315 349 382 395 406 419 419 426 439
Dallas 302 352 386 409 385 364 357 353 335 434
Denver 281 324 366 406 406 359 373 373 347 386
Detroit 314 350 356 369 369 377 3% 412 433 441
Kansas City 307 340 372 394 397 404 410 427 436 498
Los Angeles 336 375 375 452 445 433 457 465 472 541
Minneapolis 276 314 351 388 372 397 407 417 426 461
New Orleans 297 325 350 376 376 311 376 3% 372 469
New York 250 274 303 334 361 381 408 427 456 470
Philadelphia 267 307 324 354 374 393 418 431 454 559
Pittsburgh 282 304 324 342 370 370 372 373 383 428
St Louis 262 297 306 318 350 362 378 382 400 448
San Francisco 307 330 381 400 407 411 442 455 464 508
Seattle 327 363 386 387 389 397 401 405 414 450
i Published in Engineering News Record monthly in the second issue of the month with summaries in the
third issue of the March and December issues.
Example 6 Estimation of labor requirements. Consider a highly automated
processing plant having a capacity of 100 tons/day of product and requiring
principal processing steps of heat transfer, reaction, and distillation. What are the
average operating labor requirements for an annual operation of 300 days?
So&ion. The process plant is considered to require three process steps. From Fig.
6-8, for a capacity of 100 tons product/day, the highly automated process plant
r requires 33 employee-hours/day/processing step. Thus, for 300 days annual
operation, operating labor required = (3X33X300) = 29,700 employee-hours/year.
Because of new technological developments including computerized con-
trols and long-distance control arrangements, the practice of relating
employee-hour requirements directly to production quantities for a given prod-
uct can give inaccurate results unless very recent data are used. As a general