
Page 221 - Plant-Based Remediation Processes
P. 221
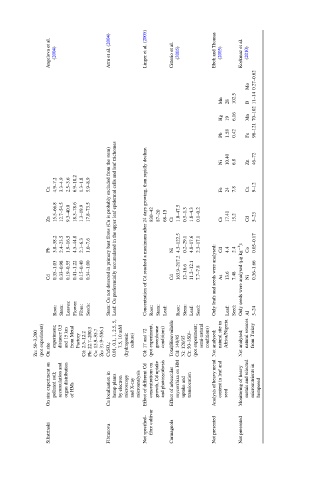
Angelova et al.  (2004)  Arru et al. (2004)  Linger et al. (2005)  Citterio et al.  (2005)  Eboh and Thomas  (2005)  Korkmaz et al.  (2010)


                                                                        0.27–0.62
                                                                      Mo

                                                               Mn  28  102.5  B  11–14

                                                               Hg  19  6.16  Mn  70–102

                                                               Pb  1.58  0.42  Fe  98–121


                                                                 10.40  46–72
                                                               Ni  6.8  Zn

                 4.9–7.2  3.3–4.9  2.5–3.6  6.9–10.2  1.3–1.8  5.9–8.9
               Cu                                              Fe  24  7.8  Cu  9–12

                 15.5–66.8  12.7–54.5  9.3–40.0  18.3–78.6  1.3–19.9  17.8–73.5  830–42  87–20  68–15  1.0–47.5  0.5–1.3  1.8–4.3  0.1–0.2

               Zn               Stem: Cu not detected in primary bast fibres (Cu is probably excluded from the stem) Leaf: Cu preferentially accumulated in the upper leaf epidermal cells and leaf trichomes Concentration of Cd reached a maximum after 24 days growing, than rapidly decline.  Cr  Cr  17.41  15.2  Cd  5–23

                 3.8–38.2  2.4–23.5  1.9–16.5  4.5–44.8  2.1–6.3  1.0–7.6  4.3–122.5  0.2–29.1  4.8–17.6  2.3–17.1  0.05–0.17
               Pb                                Ni            Cd  4.4  2.4  Co
                 0.35–1.03  0.33–0.98  0.19–0.55  0.41–1.22  0.15–0.40  0.34–1.00  163.9–217.2  12–16.6  11.2–12.1  7.7–7.8  0.36–1.66

               Cd                                Cd          Only leafs and seeds were analysed:  As  13.6  7.48 Only seeds were analysed (μgkg  1 ):  Ni


                 Root:  Stem:  Leaves:  Flower:  Fibre:  Seeds:  Root:  Stem:  Leaf:  Root:  Stem:  Leaf:  Seed:  Leaf:  Seed:  Al  5–24


           Zn: 50–3,200  (pot experiment)  On site  experiment;  distance 0.5  and 15 km  from Metal  Factory  Cd: 2.5–12.2  Pb: 22.7–200.3  Cu: 13.9–95.7  Zn: 31.9–536.1  CuSO 4 :  0.01, 0.1, 1, 2.5, 5,  7.5, 10 mM  (hydroponic  culture)  Cd: 17 and 72  (pot experiment,  greenhouse  conditions)  Total/Bioavailable  Cd: 140/45  Ni: 120/35  Cr: 50


               On site experiment on  polluted soil;  accumulation and  organ distribution  of HMs  Cu localisation in  hemp plants  by electron  microscopy  and X-ray  microanalysis  Effect of different Cd  concentrations on  growth, Cd uptake  and photosynthesis  Effect of arbuscular  mycorrhiza on HM  uptake and  translocation  Analysis of hea


               Silistrinski     Fibranova  Not specified–  fibre cultivar  Carmagnola  Not presented  Not presented