
Page 63 - Practical Control Engineering a Guide for Engineers, Managers, and Practitioners
P. 63
38 Chapter Three
u,
~Val\e
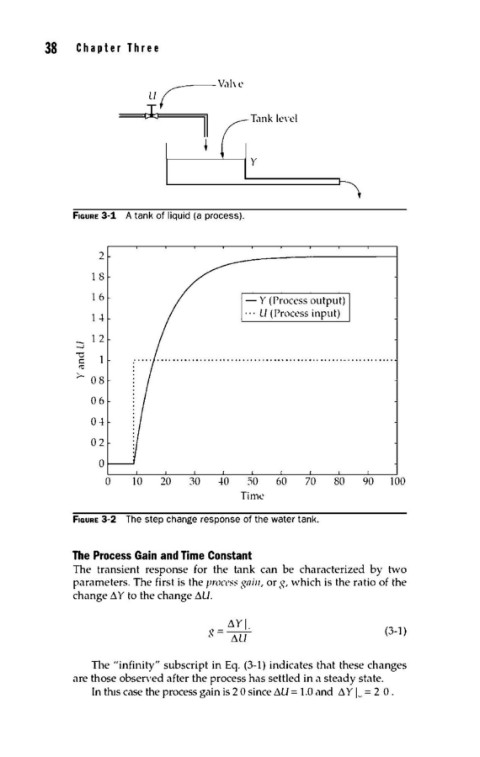
FIGURE 3-1 A tank of liquid (a process).
2
1 8
1 6 - Y (Process output)
· · · U (Process input)
1 -l
::::::; 12
u
c
.,.
>- 0 8
06
0-l
02
0
0 10 20 30 -!0 50 60 70 80 90 100
Time
FIGURE 3-2 The step change response of the water tank.
The Process Gain and Time Constant
The transient response for the tank can be characterized by two
parameters. The first is the process xaill, or x, which is the ratio of the
change~ Y to the change ~U.
(3-1)
The "infinity" subscript in Eq. (3-1) indicates that these changes
are those observed after the process has settled in a steady state.
In tlus case the process gain is 2 0 since ~U = 1.0 and ~ Y 1. .. = 2 0 .