
Page 16 - Pressure Vessel Design Manual
P. 16
Stresses in Pressure Vessels 3
material depends only on the numerical magnitude of the biaxial state of stress where 01 > (~2, the maximum shear
maximum principal or normal stress. Stresses in the other stress will be (al - (s2)/2.
directions are disregarded. Only the maximum principal Yielding will occur when
stress must be determined to apply this criterion. This
theory is used for biaxial states of stress assumed in a thin-
walled pressure vessel. As will be shown later it is unconser-
vative in some instances and requires a higher safety factor Both ASME Code, Section 1'111, Division 2 and ASME
for its use. While the maximum stress theory does accurately Code, Section 111, utilize the maximum shear stress criterion.
predict failure in brittle materials, it is not always accurate This theory closely approximates experimental results and is
for ductile materials. Ductile materials often fail along lines also easy to use. This theory also applies to triaxial states
45 to the applied force by shearing, long before the tensile of stress. In a triaxial stress state, this theory predicts that
or compressive stresses are maximum. yielding will occur whenever one-half the algebraic differ-
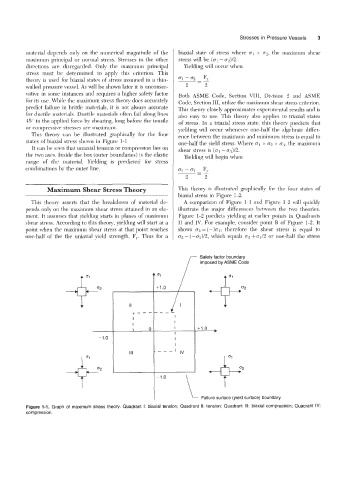
This theory can be illustrated graphically for the four ence between the maximum and minimum 5tress is equal to
states of biaxial stress shown in Figure 1-1. one-half the yield stress. Where c1 > a2 > 03, the maximum
It can be seen that uniaxial tension or compression lies on shear stress is (ul -
tlir two axes. Inside the box (outer boundaries) is the elastic Yielding will begin when
range of the material. Yielding is predicted for stress
combinations by the outer line. 01 - 03 - F,
2 2
Maximum Shear Stress Theory This theory is illustrated graphically for the four states of
biaxial stress in Figure 1-2.
This theory asserts that the breakdown of material de- A comparison of Figure 1-1 and Figure 1-2 will quickly
pends only on the mdximum shear stress attained in an ele- illustrate the major differences between the two theories.
ment. It assumes that yielding starts in planes of maximum Figure 1-2 predicts yielding at earlier points in Quadrants
shear stress. According to this theory, yielding will start at a I1 and IV. For example, consider point B of Figure 1-2. It
point when the maximum shear stress at that point reaches shows ~2=(-)(~1; therefore the shear stress is equal to
one-half of the the uniaxial yield strength, F,. Thus for a c2 - ( -a1)/2, which equals o2 + a1/2 or one-half the stress
r Safety factor boundary
imposed by ASME Code
9 / t O1
l+l.o
01
I
+l.O
-1.0 I
I
111 ____I IV
\
I -'.O
I Failure surface (yield surface) boundary
Figure 1-1. Graph of maximum stress theory. Quadrant I: biaxial tension; Quadrant II: tension: Quadrant Ill: biaxial compression; Quadrant IV:
compression.