
Page 155 - Pressure Swing Adsorption
P. 155
: I
130 PRESSURE SWING ADSORPTION EQUILIBRIUM THEORY 131
I
time according to:
Yin= y(z = O,t') = Yb(t) =Ye+ (YPR,,,.,, - YF)e-<"'1•A,s/V,,v,)1'
' 0.8
( 4.61)
06
r R
Material at this composition enters the bed at t ': and it reaches the shock 0.4
wnvc ai 1. The shock wave velocity vanes as the composition at its trailing
0.2
edge varies, that is,
( 4.62)
'
l
Likew1se, the velocity of the charactenstic that intersects the shock wave at 0
I (a)
the trailing edge varies depending on its compositiont as follows:
(4.63)
0.10
Solving Eos. 4.61 and 4.63 simultaneously for Yb yields an exoress1on for t 1n 0.08
terms of z and i. The path of the shock wave can be de term med by
0.06
mtegratmg Eq. 4.62, for examoie R
0.04
ddz\ = K[_J + (/3- l)yb] =f(yb(z.i,t'(z,t))) ( 4.64) 0.02
I SH
To simulate a complet~ PSA cycle when both dead volumes are significant
calls for only two more oarameters to be specified than for a system without
dead volumes. Deso1te that, the pressure rat10, feed composition, and adsor-
bent selectiv1ty all affect the impact of both dead volumes. Hence, to present
a general oersoect1ve would reqmre more space than is available here. As an
alternative, it ts'possible to keep details to a mm1mum, yet get a sense of the
{b)
important factors, by restnctmg attention to a smgle dead volume. Since 1t 1s
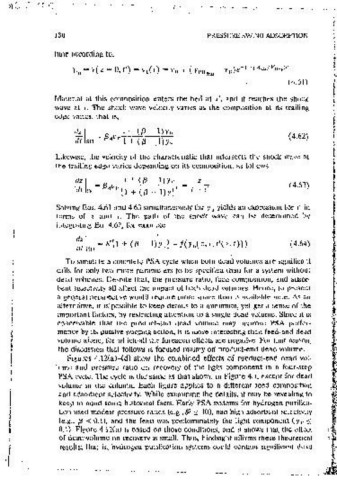
conceivable that the proctuctwenct dead volume may improve PSA perfor- Figure 4.12 Predicted recovery versus Pressure ratio and percent dead volume: (a)
mance by its passive ourging·action, it 1s more interesting than feed-end dead /3 ~ 0.1, Yo~ 0.J, (b) /3 - 0.9, Ye - 0.1. 23
voiume aione, for which all the foreseen effects are negative. For that reason,
the discussmn that follows is focused mamly on oroduct-end dead volume.
Figures 4.12(a)-(d) show the combined effects of product-end dead vol-
ume and pressure ratio on recovery of the light component in a four-step volume, as in conventional actsorbers, without suffenng much loss in recovery.
PSA cycle. The cycle 1s the same as that shown m Figure 4.1, except for dead At the present ttme, increasmgly more difficult PSA applications are bemg
volume m the column. Each figure applies to a different feed composition considered, and an approoriate Question is whether column designs need to
and adsorbent selechv1ty. While exammmg the detaiis, 1t may be revealing to be modified to accommodate them. For example, the predicted recovery for a
keep in mmd some historical facts. Early PSA systems for hydrogen purifica- system havmg low adsorbent select1v1ty is shown m Figure 4.12(b). To be
tion used modest pressure ratios (e.g., P ~ 10), had high adsorbent selectivity specific, the conditions are the same as for Figure 4.12(a), except that
(e.g., f3:,; 0.1), and the feed was oredommately the light component (ye:,; . /3 = 0.9 in that figure mstead of f3 = 0.1. The effect of cteact volume 1s severe,
(U), Figure 4.12(a) ts based on those conditions, and it shows that the effect except at low pressure ratios (e.g., P s; 3). Converselyj at moderate to large
of dead volume on recovery is small. Thus, hindsight affirms these theoretical
pressure ratios (e.g., P;;::: 10), there is a 50% drop in recovery for only 10%
results; that is, hydrogen purification systems could contain significant dead dead volume, and nil recovery for dead volumes of 20% or greater.