Page 185 - Pressure Swing Adsorption
P. 185

PRESSURE SWING ADSORPTION               EQUILIBRIUM THEORY                                           161
             160
             and  blowctown  [Figure  4.24(b)],  over  identical  pressure  ratios,  calculated  by   the effect of '3  nonlinear isotherm and  the effect of usm:g  the Ergun equation
             numerical integration of Ea. 4.77. 36   Blowctown is clearly slower than oressur-  for  pressure  drop  (in  place  of  Darcy's  Law)  have  been  mvesttgated  by
                                                                                                          -
             izat10n.  The  dimensionless  times  for  pressunzatton  and  blowdown  are,  re-  Rodrigues et al. 33 36
             soecllvely,  about three and ten times the charactenst1c time defined by:        One  situation of special  interest  1s  to  use  a  PSA  process  to  conc.entrate
                                                                                           strongly adsorbed  comoonent(s) from  a feed  of low concentration.  An exam-
                                                                                                                              36
                                                                                            ple of this was studied by Rodrigues et al.  The bed is 1hitially at eauilibnum
                                                                       (4.81)
                                                                                           with  a  linearly  adsorbed  light  component,  at  mole  frattIOn  0.5  and  a  total
                                                                                            pressure of 5.0 atm. As the bed is  deoressunzect to atmosohenc pressure, the
                In this example, the pressure profiles during pressunzatton and blow~own    pressure  along  the  axis  of  the  bed  responds  as  shown  m  Figure  4.25(a).
              both  assume the form of simple propagating waves.  With mixtures of drffer-  Simultaneously,  as  shown  in  Figure  4.25(b),  the  mole  fraction  of the  more
              ently adsorbed components (or with mrxtures of inert and_ adsorbing spec1~s)   strongly  adsorbed  component  r1ses  rapidly  at  the  open  end  of the  bed,  to
              the profiles assume more comolex forms.  Many such ram1ficat1ons,  mcludmg    about 0.65, and the profile then pivots about this point until it reaches a more
                                                                                            or  less  uniform  profile  through  the  bed.  Thereafter,  the  profile  remains
                                                                                            almost uniform through  the  bed,  rising asymptotically towards  YA  :::::  0.90.  At
                                                                                            this  ooint 1  essentially  aII  the  less  strongly  adsorbed  species  have  been  re-
                         s                                                          I       moved  from  the  bed,  and  1t  would  be  possible,  in  principle,  to  recover  the
                                                                                    I       strongly adsorbed species m  highly concentrated form  by deep evacuation  of
                                                                                     l
                                               3.,                 1                        the bed (see Sect10n 6.10 ).
                                            t,  t,                                            An  alternative  approach  has  been  followed  by  Scott, 38   who  has  shown
                                                                                            that,  if  the  column  can  be  regarded  as  mfimtely  iong,  a  relatively  s1mole
                         4
                                                                                            analytical solutwn may be obtamed.  Profiles of oressure and composition for
                                                                                            oressunzation  and  blowdown,  calculated  with  parameters  reoresentat1ve  of
                                                                                            air-zeolite  SA,  are  shown  ill  Figure  4.26.  The  composition  profiles  for
                                                                                            pressurization  fFigure  4.26(a)J  show  a  complex  wave  form  that  includes  a
                                     A
                         3                                                                  partial shock, which appears as an inflection at small values of 0. The orofiles
                                                                                            for  blowdown  [Figure  4.26(b)l  contam  only  s1mole  waves;  that  is,  they  are
                      ~                     I                                               everywhere concave downwards.
                      ~
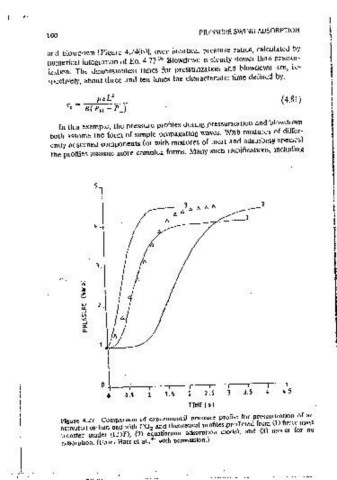
                     -"      ;.I            I                                                 The effect of finite mass transfer rate has been mvestigated by Hart et al.  39
                     w    2               ,  I                                              Their exoenmental  data for  oressunzat10n  of an  activated  carbon  bed  with
                     0:
                     ::,                 I                                                  CO  are  shown  m  Figure  4.27  together  with  theoretical  curves  calculated
                     ~                                                                         2
                      ~
                      w                                                                     according  to  tht"ee  different  assumptions:  negligible  adsorption,  instanta-
                      0:
                      n.                                                                    neous  adsorption,  and  adsorptton  at  a  fimte  rate  according  to  the  linear
                                                                                            dnv1ng force (LDF) model (k  - 0.2 s- '). The expenmental data lie closest to
                          i
                                                                                            the fimte rate model, although there is a significant devrnt1on  in the long-time
                                                                                            region. It seems  likely that  this  dev1at1on  may  be  attributed  to  heat effects,
                                                                                            which  will reduce adsorption m the long-time region.
                          o L-,--.--,--.---,--.---r-,----,
                            0   o.,   1   LS    2   2,5   3   3.5       ,.5
                                                TJHE  Isl                                   4.10  Conclusions
                Fig  r  4 27  Companson  of expertmental _pressure  profile  for  pressunzatmn  of an   The iocal equilibnum theory approach 1s the s1rnolest available for s1mulatmg
                act::a~eci carbon bed with CO and theoretical profiles _predicted.from (1) fimte  mass   or designing PSA systems.  Furthermore, when ctata are soarse (e.g., no PSA
                                       2
                transfer  model  (LDF),  (2)  equilibrium  adsorption  model,  and  (3)  model  for  no
                adsorption. (From Hart et al.,  39   with  oerrn1ssionJ                     pilot plant data),  it  is  the  most  reliable  method  because  It  does  not depend
   180   181   182   183   184   185   186   187   188   189   190