Page 205 - Pressure Swing Adsorption
P. 205

;l.
                                                                                    !
              182                                   PRESSURE SWING ADSORPTION               DYNAMIC MODELING  OF A  PSA  SYSTEM                          183
                                                                                    l
                      10' ,-----------------------,                                                          100                         6b


                                                                                                                                         40
                                                                                                           g   95   ~
                                                                                                           "                                C
                                                                                                                                            0
                                                                                                            §_
                                           '---                                                            .s    " DiffusK>n model (constant D)   "'  g
                                              ~
                                         ·-··-··-· -~                                                       C     LDFmodel               30   ·1-
                   .n.                                                                                      0                               a
                            --·---·--···--·-->_-                                                           g  90                            c
                                                                                                           ·c                               ~
                                                                                                                                            >
                                                                                                                                         20  0  u
                                                                                                           *
                       10                                                                                                                   e
                                                                                                            0
                                                                                                           0
                                                                                                           ::i:   as                        *
                                                                                                                                         10
                                                                                                              '°o               100     160
                                                                                                                                         0
                                                                                                                  Adsorption/desorpuon time (s)
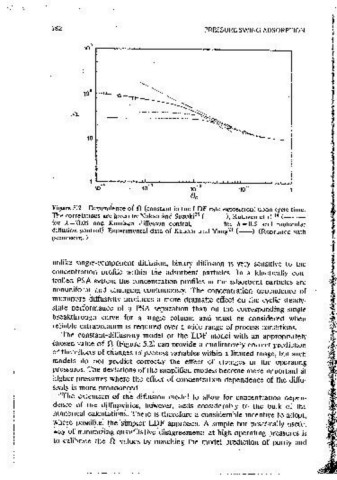
              Figure 5.2  Dependence of .0 (constant in the LDF rate exPression) upon cycle  time.   Figure 5.3  Companson  of the  predictions  of  the  diffusion ,and  LDF  models  for  a
              The corre1at1ons are given by Nakao and Suzuki  35   (---.), Ruthven et'al.  14   (-- ·-  Skarstrom  PSA  cycle  showing  the  performance  of  two  available  correlations  for
              for  A= 0.05  and  Knudsen  diffusion  control,  --·-- for  A= 0.5  and  molecuiar   estJrnatmg  the  appropriate  value  of  n  as  a  function  of  cycle  time.  Pressur~
              diffusion  control).  Expemnentai data of Kapoor and  Yang  21   (--). (Reprinted with   1zation/blowdown  timc=20  s,  L/ooH=25  s,  G=l.0,  DA/rJ=3.73xI0-  1   s-i,
              oermiss1on.)                                                                  D 8  I r"z  = 1.17x 10-  4   s~  .  other  parameters  are  same  as  m  Table  5.8.  (From
                                                                                                               1
                                                                                            Ref. 26.)
              unlike  single-component  diffusion,  binary  diffusion  1s  very  sensitive  to  the
              concentration  orofile  within  the  adsorbent  oarticles.  In  a  kinetically  con-  recovery with limited exoerimental data for the reg10n of interest and then to
              trolled  PSA system th_e  concentration profiles  m the adsorbent  particles  are   use these !l values to mvestigate the effects of the other ooeratmg variables ..
              nonuniform  and  changing  continuously.  The  concentration  deoendence  of   Kapoor and Yang 21   used this approach m their study of kinetic separation of
              m1cropore  diffusivity  produces a  more  dramatic  effect  on  the  cyclic  steady-  methane  from  a  mixture  of  methane  and  carbon  dioxide  over  a  carbon
              state  performance  of  a  PSA  separation  than  on  the  corresponding  smgle   molecular  sieve.  Others 20   have  used  the  constant-diffus1v1ty  pore  diffusion
              breakthrough  curve  for  a  smgle  column  and  must  be  considered  when   model  with  the  diffus1v1ty  values  obtained  by  calibratihg  the  model  against
              reliable extrapolation ts  reqmred over a wide range of process conditions.   limited  number  of  experimental  runs.  The  constant-diffusivity  m1cropore
                The  constant'diffus1v1ty  model  or  the  LDF model  with  an  appropriately   diffus10n  model  using  calibrated  effective  diffusivit1es  iS,  however,  no  hctter
              Chosen value·of n' (Figure 5.2) can provide a qualitatively correct prediction   than a LDF model usmg the lim1ting diffusivity with  the calibrated n.  values.
              of the effects of changes m  pro<;;ess variables within a  limited range, but such   In view  of the computat10nal  efficiency,  the  latter approach  appears  prefer-
              models  do  not  predict  correctly  the  effect  of  changes  m  the  operatmg   able.  The  lim1tatmns  of the  LDF  model  discussed  here  are,  however,  not
              pressures. The deviations of the simplified models become more 1moortant at   important for separations based on differences in adsorption equilibrium. For
              higher pressures where  the effect of concentration dependence of the diffu-  this class of separations,  the  LDF moctei  approach  1s  adequate  m almost  all
              sivity is  more pronounced.                                                   situations.
                The  extens10n  of the  diffuSion  model  to  allow  for  concentration  depen-
              dence  of 'the  diff~sivities,  ho·wever,  adds  considerably  to  the  bulk  of the
              numerical  calculations. There is  therefore a considerable incentive to adopt,   5.1.4  Numerical  Methods
              where  possible;  the simpler  LDF approach.  A  simple  but  practically  useful   Even  the  simplest  PSA  model  including  mass  transfer  resistance  is  not
              way of m1mmiZing  Quantitative 'disagreements at high ·operating pressures is   amenable to anaiytic solut10n, and efficient numencal methods for solving the
              to  calibrate  the  !1  values  by  matching  the  model  prediction  of punty  and   coupled  partial  differential  equations  are  therefore  needed  to  solve  1he
   200   201   202   203   204   205   206   207   208   209   210