
Page 210 - Pressure Swing Adsorption
P. 210
n
l 11,
I,
'
186 PRESSURE SWING ADSORPTION DYNAMIC MODELING OF A PSA SYSTEM 187
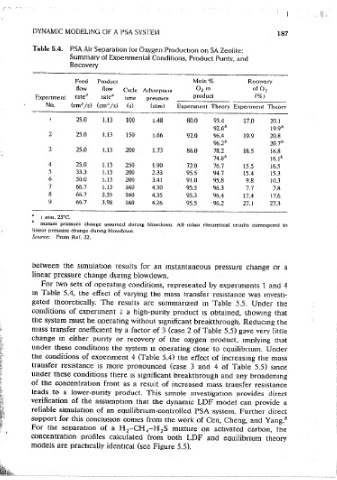
Table 5.3. Kinetic and Equilibrium Data and Other Common Table 5.4. PSA Air Separation for Oxygen Production on SA Zeolite;
Parameter values Used in the Simulations of PSA Air Summary of Expenmental Conditions, Product Purity, and
Separation for Oxygen Production Recovery
Feed composilion 21% oxygen, 79% nitrogen Mole%
Adsorhen( Linde 5A zeolile Feed Product Recovery
How flow Cvcle Adsorp11on 0 2 m of 0
Bed length (cm) 35.0 ratea rate 11 product (%) 2
Bed radius (cm) 1.75 ' Expenment time pressure
i
No.
I
Particle diameter (cm) 0.0707 I (cm' /s) (cm.; /s) (s) (aim) Experiment Theory Experiment Theorv
Bed void8ge 0.40 25.0 1.13
Amhient temperature (°C) 25.0 I 100 l.48 80.0 93.4 17.0 20.1
Blowdown pressure (atm) l.0 2 25.0 1.13 92.6b 19.9"
Purge pressure (atm) l.07 ± 0.05 I 150 I.66 92.0 96.4 19.9 20.8
I
Peclet number 500.0 ' 3 25.0 96.2/, 20.71>
Dur:it1on of s1ep I or 3 0.3 of total cvc\e trme ! . i. 13 200 1.73 86.0 78.2 18.5 16.8
Duration of step 2 or 4 0.2 of total cvcle time 1 4 74.8h 16.1 11
I
Equilibrium constant l 5 25.0 l.13 250 1.90 72.0 76.7 15.5 16.5
33.3
1.13
200
for oxygen (KA) 4.1° ! 2.33 95.5 94.7 15.4 15.3
6 50.0 1.13 200 3.41 91.0 95.8 9.8 10.3
Equilibnum constant
7 66.7 1.13 160 4.30 95.5 96.3 7.7 7.8
for nitrogen (K ) 14.8°
8 8 66.7 2.55 160 4.35 95.3 96.4 17.6
LDF constant for 9 66.7 3.98 17.4
1
oxygen (kA)(s- ) 62.0 (at I atm)b 160 4.26 95.5 96.2 27.1 27,3
LDF constant for I atm. 25°C.
nitrogen (k ) (s- 1 ) 19.7(at I atm)b
8 lnsiant pressure change assumed durmg blowdown. All other 1heoret1cal results correspond to
Satui-alion consrant for
linear pressure change dunog hlowdown
oxygen (q AS) (mol/cm·') 5.26 X 10-Jc Srmrce: From Ref. 22.
Sa1ura11on constant for
3
nitrogen (q 85 ) (mol/cmJ) 52.6 X 10- J
52
Chromatographic data (dimens10nless) (Boniface ). between the s1muJat1on results for an instantaneous pressure change or a
1, Molecular diffusion control, tonuos1ty factor= 3.0 and particle porosnv = linear pressure change during blowdown.
0.33; all expenmental conditions are within the iarge-cycle-time region, for
which n approaches the GluecJrnuf limn of 15. For two sets of operating conditions, represented t,y experiments 1 and 4
Miller et al.j 3 m Table 5.4, the effect of varying the mass transfer Tes1stance was investi-
J Since oxygen and nitrogen molecules are about the same size, their sarura- gated theoretically. The results are summarized in Table 5.5. Under the
11011 capaci1ies are assumed to be 1he .same.
conditions of expenrnent 1 a high-purity product is obtained, showmg that
the system must be operating without significant breakthrough. Reducing the
mass transfer coefficient by a factor of 3 (case 2 of Table 5.5) gave very little
together with the theoretically predicted values from the numerical simula- change in either punty or recovery of the oxygen t>roduct. 1rnolying that
tion. The mole fraction of oxygen m the product refers to the average oxygen under these conditions the system 1s operating close 'to eauilibnum. Under
concentration in the product at steady state. The theoretical oxygen concen- the conditions of expenment 4 (Table 5.4) the effect of increasing the mass
tration m the product at steady state was therefore computed at short transfer resistance is more pronounced (case 3 and 4 of Table 5.5) smce
mtervals anct was integrated to detennine the average. Since the product rate under these conditions there 1s significant breakthrough and any broadening
rather than the purge rate was fixed, the recovery calculation was straightfor- of the concentration front as a resuit of increased mass transfer resistance
ward. The-effects of cycle time, adsorption pressure, and product withdrawal leads to a lower-purity product. This s1moie mvestigat1on provides direct
rate on the purity and recovery are shown m Figure 5.4. It is evident that the verification of the assumption that the dynamic LDF modei can provide a
theoretical moctei gives a reasonably accurate prediction of both the ounty reliable simulation of an eauilibnum-controlled PSA ·system. Further direct
and recovery of the oxygen product over the range of exoenmental values support for this conctusmn comes from the work of Cen, Cheng, and Yang. 8
examined. For the separation of a H -CH -H S mixture on activated carbon, the
2
4
2
The effect of varymg the blowctown conditions was also tnvestlgated and concentration profiles caicuiated from both LDF and eauilibrium theory
the results are shown m Figure 5.4(a). There 1s clearly very little difference models are oract1cally identical (see Figure 5.5).