
Page 212 - Pressure Swing Adsorption
P. 212
ii I
i\l
188 PRESSURE SWING ADSORPTION DYNAMIC MODELING OF A PSA SYSTEM 189
X
X
80 80
+> 30 +> 30
u X C u
0 m 0 C
u m u ru
0 >- 0 m
L X L >-
"- 60 0 "- 60 X
0
C 4- C
0 ~
0
C 20 >- C 20 ,._
m m
m L m ,._ L
m
>- > X m
X 0 X >
0 40 u 0 40 -~ 0 u
H m N ru
L
L
,"! "' ,"!
0 X Exper1mental 0 "'
>: 10 >: X 10
LOF modQJ
20 Linear pressure change 20
during bJowdown
lnstont pressure change X Experimental
during bJowdown LDF modei
o'-~-'-~-'-~-'-~-~~~ o 0 0
50 1 OD 150 200 250 300 I. 25 i. 75 2.25 2. 75 3.25 3. 75
Cycle time (s) Adsorption pressure Cotm)
(a) (b)
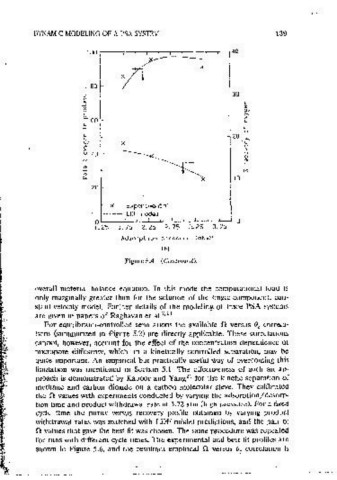
Figure 5.4 Effects of (a) cycle time (cxpenments 1-4 m Table 5.4), (b) adsorotmn Figure 5.4 (Continued).
pressure (experiments 3, 5, and 6 m Table 5.4) on punty ano recovery of oxygen
product in <l dual-bed PSA a!f separation proCC!ss operated on a Skarstrom cycle.
Equilibrium and kinetic data and other common parameter values used for computmg
the LDF model predictions are given m Table 5.3. (From Ref. 22) overall material balance eouatton. In this mode the computational load 1s
only margmally greater than for the solutmn of the Single-component, con-
stant-veioc1ty model. Further details of the modeling of trace PSA systems
7 10
are given in paoers of Raghavan et aJ. •
The sunulation model discussed here may be applied to any other binary For equiJibrium-controllect separat10ns the available .0 versus (\ correla-
bulk separation usmg a two-bed process operated on a Skarstrom cycle. t10ns (summarized m Figure 5.2) are directly applicable. These correlatmns
Perhaps a more important obsezvation is that the model can handle mass cannot, however, account for the effect of the concentratLOn deperidence of
transfer between fluid anct solid adsorbent with fotward and reverse flow micropore diffus1vity, which, in a kinettcally controlled separation, mav be
under both constant and vatymg column pressure conditions. The linear qmte important. An emp1ncal but practically useful Way of overcoming this
pressure change approximation may be easily modified to include the actual limitation was mentioned m Sectmn 5.1. The effectiveness of such an ap-
pressure-time history either directly or through a best fit eauation. The way proach is demonstrated by Kaooor and Yang 21 for the kinetic separation of
m which the pressure eaualization step is handled does. not depend on the methane and carbon dioxide on a carbon molecular :sieve. They calibrated
mass transfer model and 1s discussed in the context of the diffusion model. the O values with expenments conducted by varymg the adsorption/desorp-
This s1muiation model therefore contains all the information necessary to tion time and product withdrawal rate at 3. 72 atm (high pressure). For a fixed
simulate any other one- or two-bed PSA process operated on any of the cycle time the purity versus recovery profile obtained by varying product
simpler cycles. Although the computer code 1s written for a binary bulk withdrawal rates was matched with LDF model oredicuons, and the patr of
separation, 1t is in fact possible to use the same computer code to simulate a 0. values that gave the best fit was chosen. The same procedure was repeated
purification process simply by assigning a zero value to the Langmuir con- for runs with different cycle umes. The experimental and best fit profiles are
stant for the second component and bypassing the subroutine that solves the shown in Figure 5.6, and the resultant emoincai fl versus 0c correlat10n is