
Page 214 - Pressure Swing Adsorption
P. 214
,,
ii.'
' I'
190 PRESSURE SWING ADSORPTION DYNAMIC MODELING OF A PSA SYSTEM 191
7
I
80
80 - I
if.
~ - 30 z
0
:, C 0
;::
" • 0: 60 II IV
a,
0
a:
L
X
CL 60 " f- II Ill
z
0
~ ~ UJ
0 40
a z I
• - 20 " 0
C
a,
L
0
" • '
x·
>
0 40 - 0 20
u
N • I
w L
N
0
,a: 0
10
20 -
30 1,5
:,;
X Experimental f- 20 1.0
0:
LOF model
CL
10 ~ 0.5
0 0
0 2 3 4 5 0
0 4 8 12 16 20 22.5
Product rate (cc/sl
(CJ TIME.MIN
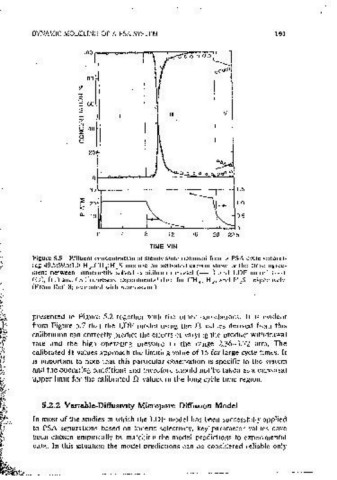
Pigure 5.4 (c) Effect of product withdrawal rate (experiments 7-9 in Table 5.4) on Figure 5.S Effluent concentration at steadv state obtained from a PSA cvcJc seoarat-
punty and recovery of oxygen product m a dual~bed PSA air separation process mg 49.5:59.5:1.0 H :CH :H S mixture on activated carboff showmg the close agree-
4
2
2
operated on a Skarstrom cycle. Equilibnum and kinetic data and other common ment between numencallv solved eauilibnum model(--) and LDF model (---).
parameter values used for computing the LDF model predictions are given m Table (0), ( □) and (t:..) represent exocnmCn1al data for CH 4 , H , and I-1 S, reSpcct1vclv.
2
2
5.3. (From Ret 22) (From Ref. 8; reonnted with pcrm1ss1on.)
presented m Figure 5.2 together with the other coffelattons. It 1s evident
from Figure 5.7 that the LDF model usrng the fl values derived from this
calibration can correctly predict the effects of varying the product withdrawal
Table S.S. Effect of Mass Transfer Resistance on Product Purity
rate and the high operating pressure m the range 2.36-3.72 atm. The
and Recovery (PSA Oxygen)"
calibrated .0 values approach the limiting value of 15 for large cycle times. It
Feed Product Mole% Recovery is important to note that this particular observation is specific to the system
rate rate kA k, 02in of0 2 and the operating conditions and therefore should not'be taken as a universal
3
3
No. (cm /s) (cm /s) (s - ') (s- I) product (%)
upper limit for the calibrated fl values m the iong-cycle-t1me region.
1 25.0 LIJ 62.0 19.7 93A0 21U0
2 25.0 LI3 20.0 6.6 93.29 20.08
3 25.0 Ll3 62.0 !9,7 76.70 16.50 5.2.2 Variable-Diffusiv1ty Micropore Diffusion Model
4 25.0 l.13 20.0 6.6 75.78 16.30
In most of the studies m which the LDF model has be.en successfully applied
For I nnd 2: i1dsorption pressure - 1.48 ;1tm, blowdown prt!ssure - 1.0, purge pressure - I.07 atm, to PSA separations based on kinetic select1v1ty, key parameter values have
cycle ume - JOO s; for 1 and 4: 11dsorpt1on pressure - J.QO atm, hlowdown pressure= l.O, purge been chosen emoincally by matching the model oredkt10ns to exoenmental
pressure= I. I aim. cvcle ume = 250 s. Other parameters as 1n Table 5.3.
. -
Source: From Ref. 22. data. In this situation the model oredict1ons can be considered reliable only