Page 219 - Pressure Swing Adsorption
P. 219

I  jj'

               196                                   PRESSURE SWING ADSORPTION               DYNAMIC  MODELING  OF A PSA SYSTEM                           197
               Ta.hie 5.6.  (Conttrmed)                                                            Ta.hie 5.8.  Kinetic and Equilibnum Data and Other Common
                                                                                                            Parameter values Used in the Simulations of PSA Air
                 Except 'for the following changes all  other eQuations m Table 5.2 appiy. The subscnpt i  has   Separation for Nitrogen Production"
               the same meaning as m Table 5.2.
               The appropr,iate forms  for the diffusion equations are obtamed bv  substltutmg Eqs. 9 and 10 in   I   Adsorbent     Carbon molecular sieve
               the  particle  balance  equations for  component  A  (i = A  m  Eq.  3  and  componem  B  (i = B  m                    (Bergbau-Forscnung)
               Eq. 3):                                                                                Bed length (cm)               35.0
                           D,rn  [<1-0  )(·a2qA  +3.  iJqA·)+B  ("2"a +~ a"")]       1                Bed radius (cm)               1.75
                   aq, ..  =  -                                                      !                Particle size (cm)            0.3175 (pellet)
                    at   •-OA-8      B   ar1   r  Jr   A  ar1   r  rr                                               3
                               8                                                                      Particle density (g/cm )      0.9877
                             DAO    (     JOA    iJ8B)(i)qA   ilqB)        (11)      i                Bed voidage                   0.40
                        + (1-0A-8»)2  (1-8B)Jr+OATr  ¥+Jr                                             Ambient temperatuTe (°C)      25.0
                                                                                                      PecJet numbeT                 1000.0
                    iiqs =   DBo  [<i-o  )(a~qn +I iJq")+o  (<iqA  +~ iJqA)]                          Eauilibnum constam
                                                                                                       foroxygen(KA)
                    at  ·  1- 8A  - 8  8   A   .  ar2   r  Jr   8   Jr2   r  Jr                       Equilibrmm constant
                                                                                                       for nitrogen (K  )
                             D80    [    )  iJ.88   JOA j ( JqB   iJqA)     (12)                                 8
                        +  (1-6,,t-8B)2  (l-OA  ar+8BJr  7rr+7ir                                      Saturation constant for
                                                                                                       oxygen (qA )(moljcm·')       2.64  X  JO-lb
                                                                                                              5
               Similarly the appropnate boundary conditions for the two components at the particle surface are   Samration constant for
                                                                                                                       3
               obtamed  by  subs~ituung Eqs.  9  and  to  in  Eq.  5 written  for  components  A  and  B  and  solving   nitrogen (q  85  ) (moljcm )   2.64  X  l0-Jb
               simultaneously for (aqA /Jr)lr-Rp and (iJq 8 I Jr)l,-RP;                               Limiting diffusional time
                                                                                                       constant for oxygen (DAn/r}) (s- l)   2.7  X 10- 3 ,
                                                                            (13)                      Limiting diffusional time
                                                                                                       constant for nitrogen (D» /r}) (s-  1  )   5.9 X  10-s,
                                                                                                                        0
                                                                            (14)
                                                                                                     fl  values  of  14  and  85  for  oxygen  and  mtrogen,  respecnvely,  taken  from  the
                                                                                                   correlacion  of  Nakao  and  Suzuki  have  been  used  m  computl'ng  the  LDF  model
                 Equauom, 9 and  10 ure 1rue for  qAS"" q 8 s;  if this 1s  not true,  the  expressions will conwm additional   predictions.
               terms,                                                                              b  Ruthven e1  111.·\"'
                                                                                                   ~  FarooQ  and  Ruihven. u,
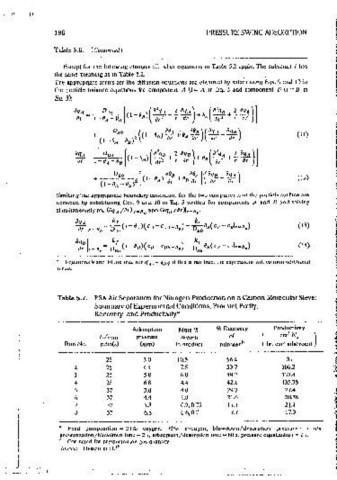
               Table 5.7.  PSAAir Separation for Nitrogen Production on a Carbon Molecular Sieve:
                         Summary of Experimental Conditions, Product Purity,                 pressures (3-7 atm)  and  therefore  provide  a  suitable  database.  The· exoen-
                         Recovery, and Productivity"                                         mental conditions and the observed  product  ounty, recovery,  and  oroduct1v-
                                                                                             1ty  are  summarized  in  Table  5.7.  The  equilibnum  and  kinetic  parameters
                                  Adsorption   Moie%   %  Recovery    Produclivity           taken from  independent, smgle-component measurements and used 1n  s1mu-
                          L/ 11 011   pressure   oxygen   of       (   cm'N,)                Jating  these  experimental  runs  are  given  m  Table 5.8,  The  diffusion  model
                 Run No.   ratio(s)   (atm)   in product   nitrogenh   hr. cm·; adsorbent
                                                                                             (with  constant  and  vanable  diffus1v1ty)  and  the  LDF model  predictions  are
                                                                                             compared with the experimental results in Figure 5.8. The oredicttons of the
                            25       3.0     10.5         56.4           81
                    2       25       4.4      7.5         53.7          106.2         (:     constant-diffusivity pore diffusion  model and  the LDF model, with  D  vaiues
                    3       25       5.8      6.0         49,2          137.4                adjusted for cycle  time  according to  the correlation of Nakao  and  Suzuki, 35
                    4       25       6.8      4.4         42.1          135.75               are  very  close.  (This  agreement  provides  additional  confirmation  of  the
                    5       37       3.0      4.0         29.2          27.4                 results shown  m Figure 5.3.) It 1s  clear (from  Figure 5;8) that  the concentra-
                    0       37       4.4      1.8         21.6          30,76                tion-dependent  diffus1v1ty  model  predicts  the  correct  qualitative  trends  for
                    7       37       5.8      0.7,0.75    II.I          21.4
                    8       37       6.8      0.6,0.7      7.7          17.3                 purity and recovery over· the  range of experimental variables exammed.  The
                                                                                             constant-diffus1v1ty  model  (and  the  LDF model),  on  the  other  hand,  cannot
                  Feed  composilion  - 21%  oxygen,  79%  nitrogen,  blowdown/desorptmn  pressurn  =  1  atm,   predict  the  correct  trend  of  recovery  with  operating  pressure,  and,  even
                rres~un:rntion/h\owdown time - 2 s,  adsorpt1on/dcsorption  time - 60 s,  pressure equalizution - 2 s.   though  this  model  predicts  the  correct  trend  for  the  variation  of  product
                  Corrected for pressunz11tion gas quantity.
                Sour.·e:  1-lass,111  et al.  111                                            punty,  the  qualitative  disagreement  at  the  higher  pressures  1s  too  large.
   214   215   216   217   218   219   220   221   222   223   224