
Page 216 - Pressure Swing Adsorption
P. 216
"' i 'I I
192 PRESSURE SWING ADSORPTION DYNAMIC MODELING OF A PSA SYSTEM 193
98 93
Cycle Time, s a'! _,._ ..
• 60 0
... 120 E 92
>-
"' '-.
96 240 ,-.. -.
"-:-r-A
* r-g,•'-------- "'.. • :::, ;--■.,\
-- - '
d,,,.-... • """'
a:
;;
E . -~~ '-...... 0.. " • -<t---\
Cl
,: 94 , . ·-,,__ ~ 0
.. -'!~ 0.. 90 "'·
>-- ' , ...... a: --~
a;
::,
'- .,.
a 92 :i: 89 PH' ptlg
.. C ■ 20
(.)
0
a:
-6 4 JO
., 0 • ,o
:c ••
u 90 0 20 ,o BO 80 100
CH PROO. RECOVERY,%
4
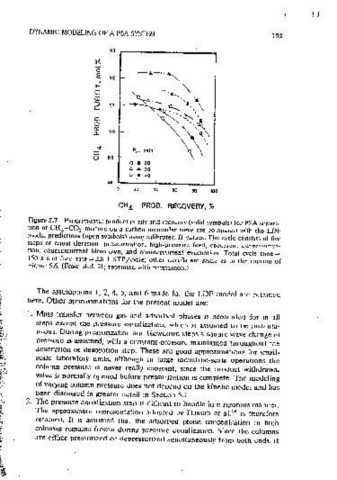
88 '-----"----'-----------~--~ Figure 5.7 Experimental product ounty and recovery (solid symbols) for PSA separa-
0 20 40 60 80 100 tmn of CH1-C0 2 mixture on a carbon molecuiar sieve are compared with the LDF
model pred1ct1ons (open svmbols) usmg calibrated O values. The cvcie consists of five
CH4 PROO. RECOVERY, '%,.
steps of equal duration: pressurization, high-pressure feed, cocurrent depressunza-
tlon, countercurrent blowdown, and countercurrent evacuation. Total cvCle time=
Figure 5.6 Performance cmves for- PSA separation of CH 4 -CO 2 mixture on a
carbon molecular sieve. The cycle consists of four steps of equal duration: pressunza- 1~0 s and feed rate= 2.8 1 STP /cycie; other details are same as m the caption of
Figure 5.6. (From Ref. 21; reprinted with penmssmn.)
uon, product withdrawal accompanied by cocurrent depressunzatton, cocurrent blow-
down and countcrcurrenl evacuation. Adsorot1on pressure ... 3.72 atm, evacuallon
press~re = 0.34 atm, feed rate= 2.7 1 STP /cycle, product withdrawai rate vaned
from 0.21 to 1.35 I STP /cycle; adsorbent diameter~ 0.318 cm, bed length~ 60.6 cm, The assumptions 1, 2, 4, 5, and 6 made for the LDF model are retained
bed radius= 2.05 cm (inner), bed voidage = 0.3. Solid symbols are exoenmental, ooen here. Other apprmamations for the present model are:
svmbois are the· best fit LDF model resuits obtamect by adjusting n values._ For
Cquilibnum and kinetic data see Table 3,2. (From Ref. 21; reprinted with permission.) 1. Mass transfer between gas and adsorbed phases 1s accounted for 10 all
steps except the pressure equalization, which 1s assumed to be instanta-
neous. During pressurization and blowdown steps a sQuare wave change in
over the range covered by the experiments. Such an approach is clearly oressur~ 1s assumed, with a constant pressure maintained throughout the
unsuitable for the a pnon prediction of system performance. A reliable and actsoroti_on or desorotion step. These are good approximations for smallw
complete a priori estimate of PSA performance, based on mctepenctentiy scale laboratory units, although m large mctustnai•Scale operations the
measured smgle-component equilibrium and kinetic data over a wide range column pressure 1s never really constant, smce the· orodu~t withdrawal
of operating conditions is a maJor target of PSA modeling. For a kinetically valve is normally opened before pressurization 1s complete. The modeling
controlled PSA separation this reauires the full micropore diffusion model of varymg column pressure does not depend on the kinetic model and has
mc!uding the conc~ntration dependence of m1cropore diffus1v1ty. 26 A simple been discussed in greater detail m Section 5.1.
two-bed process operated on a modified cycle with pressure eoualization and 2. The pressure equalization step 1s difficult to handle in a rigorous manner.
1
no external purge (Figure 3. 16) is considered, and the variable diffusivity The approximate representation adopted by Hassan et al. /i 1s therefore
m1cropore diffusion model is developed for a binary bulk separation. It 1s retained. It is assumed that the adsorbed phase concentration m hoth
impor-tant to note that the extensmn of this modei, even to three compo- columns remams frozen durmg pressure equalization. Since the columns
nents, is not straightforward. are either pressunzed or depressurized simultaneously from both ends, it