Page 304 - Pressure Swing Adsorption
P. 304

:  :11
 280   PRESSURE SWING ADSORPTION   EXTENSIONS  OF THE PSA  CONCEPT     281

 PRODUCT
          therefore be  accounted  for explicitly m any  model.  In  general Darcy's Law  1s
 'i       used  to relate the flow  to the  pressure drop through the  bed;
 I                   Kap
              v=  ---
                    &J.l  az  '                                      (7-5)
            Both  eouilibnum  and  kinetic  models  (LDF  approx1mat1on)  have  been
 I          7 .3.2  Expenmental Studies
 p        developed.
 (a)

                           5
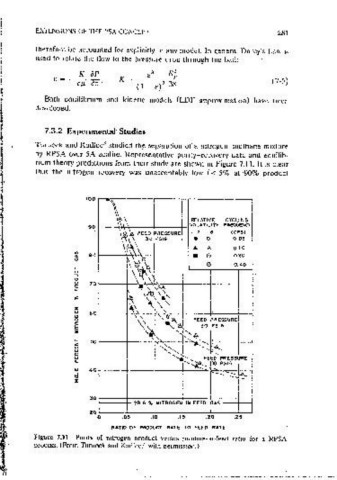
 l        Turnock and Kadlec studied  the separation of a  nitrogen-methane mixture
          by  RPSA over 5A  zeolite.  Representative  purity-recovery data and  equilibM
          rium theory predictions from  their study are shown  m  Figure 7.11.  It 1s  clear
 l,       that  the  mtrogen  recovery  was  unacceptably  low  ( < 5%  at  90%  product
  •
 '   I
 t
 FEED   WASTE
                                                         CYCLING
 (Consider bed  as  a  sanes  of  vessels)               FREQUENCY
                                                           (CPS}
                                                           0 o,
                                                 ..
 ~
 i.  Pressunsat1on   ~                           •   A     0.10
                                                            020
                                                     0
                    ~
 (b)                "'                               0      0.40
                    ~
                    0
                    ~
                    ..
                    0
                    IE
 -                  "'
 2.  Transoort  of Oz   ~
                    z
 ennched  gas  to   w
 the  next  soct1on   ,;   0  QC
                    ~
                    z
                    ~
                    z
 -                  w   40
 ,J.  Oepressur1sat1on   w
                    ..
                    0
                    QC
                    w
                    J
                    0
                    ~
                                .o,
                         0
                             RATIO  OF  PRODUCT  RATE  TO  FEED  RATE
          Figure  7.11  Purity  of  mtrogen  product  versus  product-to-feed  ratio  for  a  RPSA
 Figure  7.10  The  rapid  pressure  swmg  process  showing  _(a)  pressure  variation  and   process. (From Turnock and  Kadlec,=:;  with  oermission.)
 (b) the  analogy with  a ratchet. (From Kenney,'  with  perm1ss1on.)
   299   300   301   302   303   304   305   306   307   308   309