
Page 130 - Primer on Enhanced Oil Recovery
P. 130
120 Primer on Enhanced Oil Recovery
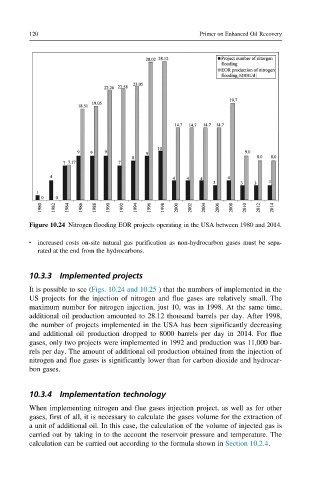
Figure 10.24 Nitrogen flooding EOR projects operating in the USA between 1980 and 2014.
increased costs on-site natural gas purification as non-hydrocarbon gases must be sepa-
rated at the end from the hydrocarbons.
10.3.3 Implemented projects
It is possible to see (Figs. 10.24 and 10.25 ) that the numbers of implemented in the
US projects for the injection of nitrogen and flue gases are relatively small. The
maximum number for nitrogen injection, just 10, was in 1998. At the same time,
additional oil production amounted to 28.12 thousand barrels per day. After 1998,
the number of projects implemented in the USA has been significantly decreasing
and additional oil production dropped to 8000 barrels per day in 2014. For flue
gases, only two projects were implemented in 1992 and production was 11,000 bar-
rels per day. The amount of additional oil production obtained from the injection of
nitrogen and flue gases is significantly lower than for carbon dioxide and hydrocar-
bon gases.
10.3.4 Implementation technology
When implementing nitrogen and flue gases injection project, as well as for other
gases, first of all, it is necessary to calculate the gases volume for the extraction of
a unit of additional oil. In this case, the calculation of the volume of injected gas is
carried out by taking in to the account the reservoir pressure and temperature. The
calculation can be carried out according to the formula shown in Section 10.2.4.