
Page 27 - Primer on Enhanced Oil Recovery
P. 27
18 Primer on Enhanced Oil Recovery
this we ought to use open porosity coefficient (Ø) and then also account for water
which will be left in pores (voids) after oil extraction.
In the void space of reservoir rocks oil contains dissolved gas. To bring the vol-
ume of reservoir oil to the volume of oil degassed under standard conditions, the
average value of the conversion factor B is used.
2.3.3 Decline curve analysis
The production decline curve is a plot of production (flow rate) of a well versus
time. This dependence is usually plotted on semi-log paper. When data stacks on a
straight line, it is extrapolated by an “exponential fall curve” with a constant fall
rate.
Analysis of changes in the rate of extraction (production) and the phase composi-
tion of the produced hydrocarbons values are jointly used as the information source,
which allows to define the value of final recoverable reserves and resources.
The change dynamics in operational performance (such as gas factor, water-oil
factor, gas-condensate factor, bottom hole/wellhead pressure) can be extrapolated to
the limit of economic profitability of reservoir development.
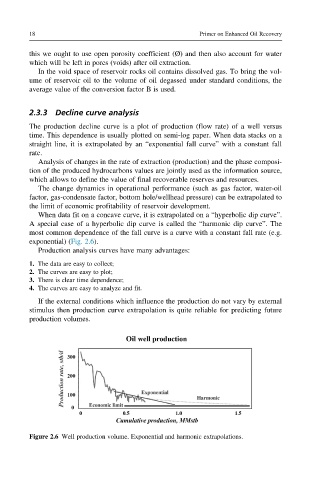
When data fit on a concave curve, it is extrapolated on a “hyperbolic dip curve”.
A special case of a hyperbolic dip curve is called the “harmonic dip curve”. The
most common dependence of the fall curve is a curve with a constant fall rate (e.g.
exponential) (Fig. 2.6).
Production analysis curves have many advantages:
1. The data are easy to collect;
2. The curves are easy to plot;
3. There is clear time dependence;
4. The curves are easy to analyze and fit.
If the external conditions which influence the production do not vary by external
stimulus then production curve extrapolation is quite reliable for predicting future
production volumes.
Figure 2.6 Well production volume. Exponential and harmonic extrapolations.