
Page 124 - Principles of Applied Reservoir Simulation 2E
P. 124
Part II: Reservoir Simulation 109
measurements because density differences between the oil and water phases are
relatively small and result in small changes in acoustic impedance.
The seismic trace plots seismic amplitude versus two-way travel time, or
the time it takes the seismic wave to propagate from the source to the receiver.
One of the central problems in seismic data processing is to determine the
time/depth conversion. The conversion of travel time data to formation depth
requires that the velocity associated with each geologic zone be known or can
be inferred as the wave evolves with time. When the time/depth conversion is
applied to seismic data, it can change the relative depths of seismic amplitudes
associated with adjacent traces.
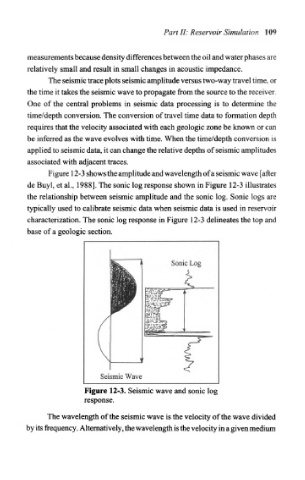
Figure 12-3 shows the amplitude and wavelength of a seismic wave [after
de Buyl, et al., 1988]. The sonic log response shown in Figure 12-3 illustrates
the relationship between seismic amplitude and the sonic log. Sonic logs are
typically used to calibrate seismic data when seismic data is used in reservoir
characterization. The sonic log response in Figure 12-3 delineates the top and
base of a geologic section.
Sonic Log
Seismic Wave
Figure 12-3. Seismic wave and sonic log
response.
The wavelength of the seismic wave is the velocity of the wave divided
by its frequency. Alternatively, the wavelength is the velocity in a given medium