
Page 125 - Principles of Applied Reservoir Simulation 2E
P. 125
110 Principles of Applied Reservoir Simulation
times the period of the wave. The frequency of the wave is a measure of the
energy of the wave and is conserved as the wave propagates from one medium
to another. The wavelength, however, can vary from one medium to another.
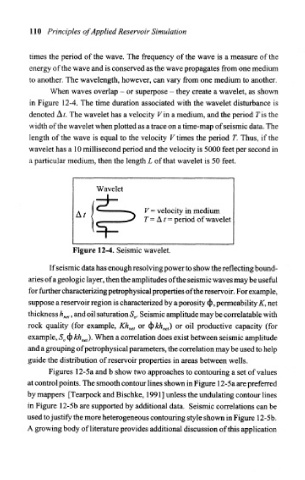
When waves overlap - or superpose - they create a wavelet, as shown
in Figure 12-4. The time duration associated with the wavelet disturbance is
denoted Af. The wavelet has a velocity Fin a medium, and the period Tis the
width of the wavelet when plotted as a trace on a time-map of seismic data. The
length of the wave is equal to the velocity V times the period T. Thus, if the
wavelet has a 10 millisecond period and the velocity is 5000 feet per second in
a particular medium, then the length L of that wavelet is 50 feet.
Wavelet
V= velocity in medium
T = A / = period of wavelet
Figure 12-4. Seismic wavelet.
If seismic data has enough resolving power to show the reflecting bound-
aries of a geologic layer, then the amplitudes of the seismic waves may be useful
for further characterizing petrophysical properties of the reservoir. For example,
suppose a reservoir region is characterized by a porosity <f>, permeability K, net
thickness h net, and oil saturation S 0. Seismic amplitude may be correlatable with
rock quality (for example, Kh net or §kh net) or oil productive capacity (for
<j> kh net). When a correlation does exist between seismic amplitude
example, S 0
and a grouping of petrophysical parameters, the correlation may be used to help
guide the distribution of reservoir properties in areas between wells.
Figures 12-5a and b show two approaches to contouring a set of values
at control points. The smooth contour lines shown in Figure 12-5a are preferred
by mappers [Tearpock and Bischke, 1991 ] unless the undulating contour lines
in Figure 12-5b are supported by additional data. Seismic correlations can be
used to justify the more heterogeneous contouring style shown in Figure 12-5b.
A growing body of literature provides additional discussion of this application