
Page 150 - Principles of Applied Reservoir Simulation 2E
P. 150
Part II: Reservoir Simulation 135
14.2 Relative Permeability and Capillary Pressure
Reservoir models calculate saturation as a function of time. Consider the
case of water displacing oil. Initially, oil occupies the interior of pore spaces,
and connate water is adjacent to the rock surface of a water-wet reservoir. When
the flood begins, water displaces oil through the interconnected pore space. The
measure of interconnectedness is permeability. The oil left behind after the
waterflood is residual or irreducible oil saturation. Similar behavior is seen for
other combinations of multiphase flow, for example, gas-oil, gas-water, and gas-
oil-water. Multiphase flow is modeled by including relative permeability curves
in the simulator. Saturation end points for the relative permeability curves are
used to establish initial fluids-in-place in addition to modeling flow behavior.
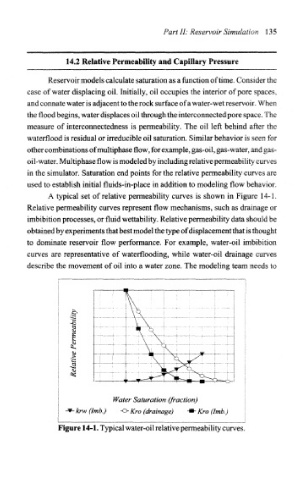
A typical set of relative permeability curves is shown in Figure 14-1.
Relative permeability curves represent flow mechanisms, such as drainage or
imbibition processes, or fluid wettability. Relative permeability data should be
obtained by experiments that best model the type of displacement that is thought
to dominate reservoir flow performance. For example, water-oil imbibition
curves are representative of waterflooding, while water-oil drainage curves
describe the movement of oil into a water zone. The modeling team needs to
Water Saturation (fraction)
krw (Imb,) -o Kro (drainage) -*- Kro (1mb.)
Figure 14-1. Typical water-oil relative permeability curves.