
Page 62 - Principles of Catalyst Development
P. 62
Part I: Reservoir Engineering Primer 43
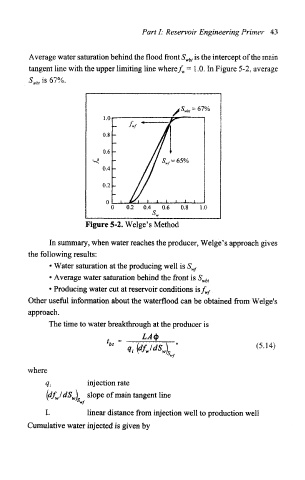
Average water saturation behind the flood front S wbt is the intercept of the main
tangent line with the upper limiting line where/,, = 1.0. In Figure 5-2, average
5^ is 67%.
0 0.2 0.4 0.6 0.8 1.0
Figure 5-2. Welge's Method
In summary, when water reaches the producer, Welge's approach gives
the following results:
• Water saturation at the producing well is S wf
• Average water saturation behind the front is S wbt
• Producing water cut at reservoir conditions isf wf
Other useful information about the waterflood can be obtained from Welge's
approach.
The time to water breakthrough at the producer is
. LA*
" " 9, (4W) V (5J4)
where
q t injection rate
(df w I dS^\ slope of main tangent line
V S
' wf
L linear distance from injection well to production well
Cumulative water injected is given by