
Page 150 - Principles of Catalyst Development
P. 150
138 CHAPTER 7
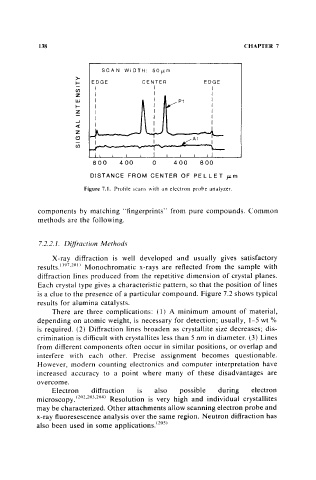
SC AN WI DTH: 50 f-Lm
>-
..... EDGE CENTER EDGE
en I I I
z I I I
lJ.J I I PI I
..... I I I
z I I I
I I I
...J I I
c( I
z I I
" AI
en
800 400 0 400 800
DISTANCE FROM CENTER OF PELLET J-Lm
Figure 7.1. Profile scans with an electron prohe analyzer.
components by matching "fingerprints" from pure compounds. Common
methods are the following.
7.2.2.1. Diffraction Methods
X-ray diffraction is well developed and usually gives satisfactory
results. (197,201) Monochromatic x-rays are reflected from the sample with
diffraction lines produced from the repetitive dimension of crystal planes,
Each crystal type gives a characteristic pattern, so that the position of lines
is a clue to the presence of a particular compound. Figure 7.2 shows typical
results for alumina catalysts.
There are three complications: (1) A minimum amount of material,
depending on atomic weight, is necessary for detection; usually, 1-5 wt %
is required, (2) Diffraction lines broaden as crystallite size decreases; dis-
crimination is difficult with crystallites less than 5 nm in diameter. (3) Lines
from different components often occur in similar positions, or overlap and
interfere with each other. Precise assignment becomes questionable,
However, modern counting electronics and computer interpretation have
increased accuracy to a point where many of these disadvantages are
overcome.
Electron diffraction IS also possible during electron
microscopy. (202,203,204) Resolution is very high and individual crystallites
may be characterized. Other attachments allow scanning electron probe and
x-ray fluoresescence analysis over the same region. Neutron diffraction has
also been used in some applications, (205)