
Page 213 - Principles of Catalyst Development
P. 213
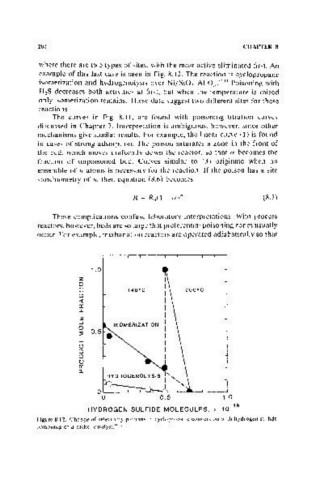
202                                                      CHAPTER  8


            where there are two types of sites,  with  the most active eliminated first.  An
            example of this  last case is  seen  in  Fig.  8.12.  The  reaction  is  cyclopropane
            isomerization and  hydrogenolysis  over  Ni/SiO r AI 20 J • (611  Poisoning  with
            H 2S  decreases  both  activities  at  flrst,  but  when  the  temperature  is  raised
            only isomerization remains. These data suggest two different sites  for these
            reactions.
                The  curves  in  Fig.  8.11,  are  found  with  poisoning  titration  curves
            discussed  in  Chapter 7.  Interpretation  is  ambiguous,  however,  since other
            mechanisms give similar results.  For example, the linear curve  (1)  is  found
            in  cases  of strong adsorption.  The  poison  saturates  a  zone  in  the  front  of
            the  bed,  which  moves  uniformly  down  the  reactor,  so that  a  becomes  the
            fraction  of  unpoisoned  bed.  Curves  similar  to  (3)  originate  when  an
            ensemble of 11  atoms  is  necessary  for the  reaction.  If the poison  has  a  site
           stoichiometry of 11,  then equation  (8.6)  becomes


                                      R  =  Roll  - a)"                   (8.7)

                These complications confuse  laboratory  interpretations.  With  process
           reactors, however, beds are so large that preferential poisoning zones usually
           occur.  For example, methanation reactors are operated adiabatically so that


                          1.0
                       z
                       0
                       I-
                       ()
                       «
                       cr
                       u..
                       W
                       ...J
                       0
                       ~   0.5
                       I-
                       ()
                       :::)
                       0
                       0
                       a:
                       a..

                                                               1.0
                          HYDROGEN  SULFIDE  MOLECULES,  x  10-   19
           Figure 8.12.  Change or selectivity  patterns in  cyclopropane conversion  with  hydrogen sulfide
           poisoning or a  nickel  catalyst. ((.11