
Page 240 - Probability and Statistical Inference
P. 240
4. Functions of Random Variables and Sampling Distribution 217
Francis Galton introduced a numerical measure, r, which he termed re-
version in a lecture at the Royal Statistical Society on February 9, 1877 and
later called regression. The term cor-relation or correlation probably
appeared first in Galtons paper to the Royal Statistical Society on December
5, 1888. At that time, correlation was defined in terms of deviations from
the median instead of the mean. Karl Pearson gave the definition and calcula-
tion of correlation as in (4.6.7) in 1897. In 1898, Pearson and his collabora-
tors discovered that the standard deviation of r happened to be
when n was large. Student derived the probable error of a correlation
coefficient in 1908. Soper (1913) gave large sample approximations for the
mean and variance of r which were better than those proposed earlier by
Pearson. Refer to DasGupta (1980) for some of the historical details.
The unsolved problem of finding the exact pdf of r for normal variates
came to R. A. Fishers attention via Sopers 1913 paper. The pdf of r was
published in the year 1915 by Fisher for all values of ρ ∈ (1, 1). Fisher, at the
age of 25, brilliantly exploited the n-dimensional geometry to come up with
the solution, reputedly within one week. Fishers genius immediately came
into limelight. Following the publication of Fishers results, however, Karl
Pearson set up a major cooperative study of the correlation. One will notice
that in the team formed for this cooperative project [Soper et al. (1917)]
studying the distribution of the sample correlation coefficient, the young Fisher
was not included. This happened in spite of the fact that Fisher was right
there and he already earned quite some fame. Fisher felt hurt as he was left
out of this project. One thing led to another. R. A. Fisher and Karl Pearson
continued criticizing each other even more as each held on to his philosophi-
cal stand.
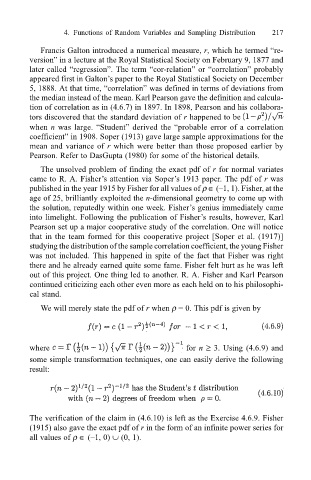
We will merely state the pdf of r when ρ = 0. This pdf is given by
where for n ≥ 3. Using (4.6.9) and
some simple transformation techniques, one can easily derive the following
result:
The verification of the claim in (4.6.10) is left as the Exercise 4.6.9. Fisher
(1915) also gave the exact pdf of r in the form of an infinite power series for
all values of ρ ∈ (1, 0) ∪ (0, 1).