
Page 264 -
P. 264
246 9 Operational Support
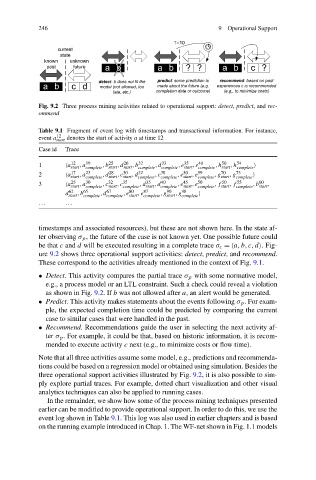
Fig. 9.2 Three process mining activities related to operational support: detect, predict,and rec-
ommend
Table 9.1 Fragment of event log with timestamps and transactional information. For instance,
12
event a start denotes the start of activity a at time 12
Case id Trace
12
33
1 a start ,a 19 ,b 25 ,d 26 ,b 32 ,d complete ,e 35 ,e 40 ,h 50 ,h 54
start
start
start
start
complete
complete
complete
complete
28
17
2 a start ,a 23 ,d start ,c 30 ,d 32 ,c 38 ,e 50 ,e 59 ,g 70 ,g 73
complete
complete
complete
start
start
complete
complete
start
25
55
40
32
50
3 a start ,a 30 ,c start ,c 35 ,d 35 ,d complete ,e 45 ,e 50 ,f start ,f complete ,b 60 ,
complete
complete
start
start
complete
start
80
98
87
62
d start ,b 65 ,d 67 ,e start ,e complete ,g 90 ,g complete
start
complete
complete
... ...
timestamps and associated resources), but these are not shown here. In the state af-
ter observing σ p , the future of the case is not known yet. One possible future could
be that c and d will be executed resulting in a complete trace σ c = a,b,c,d .Fig-
ure 9.2 shows three operational support activities: detect, predict, and recommend.
These correspond to the activities already mentioned in the context of Fig. 9.1.
• Detect. This activity compares the partial trace σ p with some normative model,
e.g., a process model or an LTL constraint. Such a check could reveal a violation
as shown in Fig. 9.2.If b was not allowed after a, an alert would be generated.
• Predict. This activity makes statements about the events following σ p . For exam-
ple, the expected completion time could be predicted by comparing the current
case to similar cases that were handled in the past.
• Recommend. Recommendations guide the user in selecting the next activity af-
ter σ p . For example, it could be that, based on historic information, it is recom-
mended to execute activity c next (e.g., to minimize costs or flow time).
Note that all three activities assume some model, e.g., predictions and recommenda-
tions could be based on a regression model or obtained using simulation. Besides the
three operational support activities illustrated by Fig. 9.2, it is also possible to sim-
ply explore partial traces. For example, dotted chart visualization and other visual
analytics techniques can also be applied to running cases.
In the remainder, we show how some of the process mining techniques presented
earlier can be modified to provide operational support. In order to do this, we use the
event log shown in Table 9.1. This log was also used in earlier chapters and is based
on the running example introduced in Chap. 1. The WF-net shown in Fig. 1.1 models