
Page 282 -
P. 282
264 10 Tool Support
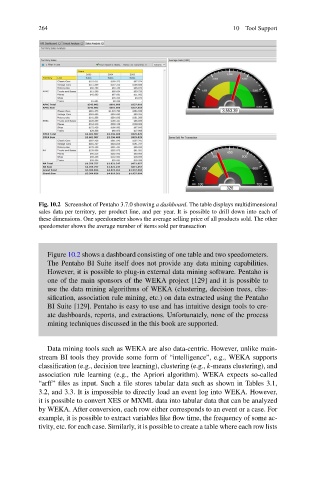
Fig. 10.2 Screenshot of Pentaho 3.7.0 showing a dashboard. The table displays multidimensional
sales data per territory, per product line, and per year. It is possible to drill down into each of
these dimensions. One speedometer shows the average selling price of all products sold. The other
speedometer shows the average number of items sold per transaction
Figure 10.2 shows a dashboard consisting of one table and two speedometers.
The Pentaho BI Suite itself does not provide any data mining capabilities.
However, it is possible to plug-in external data mining software. Pentaho is
one of the main sponsors of the WEKA project [129] and it is possible to
use the data mining algorithms of WEKA (clustering, decision trees, clas-
sification, association rule mining, etc.) on data extracted using the Pentaho
BI Suite [129]. Pentaho is easy to use and has intuitive design tools to cre-
ate dashboards, reports, and extractions. Unfortunately, none of the process
mining techniques discussed in the this book are supported.
Data mining tools such as WEKA are also data-centric. However, unlike main-
stream BI tools they provide some form of “intelligence”, e.g., WEKA supports
classification (e.g., decision tree learning), clustering (e.g., k-means clustering), and
association rule learning (e.g., the Apriori algorithm). WEKA expects so-called
“arff” files as input. Such a file stores tabular data such as shown in Tables 3.1,
3.2, and 3.3. It is impossible to directly load an event log into WEKA. However,
it is possible to convert XES or MXML data into tabular data that can be analyzed
by WEKA. After conversion, each row either corresponds to an event or a case. For
example, it is possible to extract variables like flow time, the frequency of some ac-
tivity, etc. for each case. Similarly, it is possible to create a table where each row lists