
Page 280 -
P. 280
262 10 Tool Support
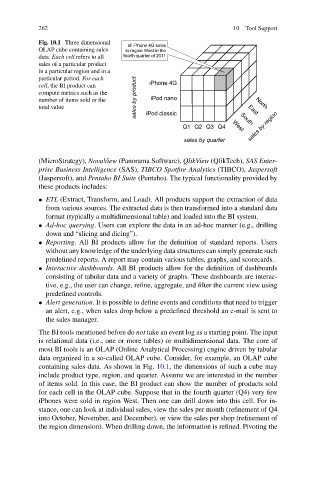
Fig. 10.1 Three dimensional
OLAP cube containing sales
data. Each cell refers to all
sales of a particular product
in a particular region and in a
particular period. For each
cell, the BI product can
compute metrics such as the
number of items sold or the
total value
(MicroStrategy), NovaView (Panorama Software), QlikView (QlikTech), SAS Enter-
prise Business Intelligence (SAS), TIBCO Spotfire Analytics (TIBCO), Jaspersoft
(Jaspersoft), and Pentaho BI Suite (Pentaho). The typical functionality provided by
these products includes:
• ETL (Extract, Transform, and Load). All products support the extraction of data
from various sources. The extracted data is then transformed into a standard data
format (typically a multidimensional table) and loaded into the BI system.
• Ad-hoc querying. Users can explore the data in an ad-hoc manner (e.g., drilling
down and “slicing and dicing”).
• Reporting. All BI products allow for the definition of standard reports. Users
without any knowledge of the underlying data structures can simply generate such
predefined reports. A report may contain various tables, graphs, and scorecards.
• Interactive dashboards. All BI products allow for the definition of dashboards
consisting of tabular data and a variety of graphs. These dashboards are interac-
tive, e.g., the user can change, refine, aggregate, and filter the current view using
predefined controls.
• Alert generation. It is possible to define events and conditions that need to trigger
an alert, e.g., when sales drop below a predefined threshold an e-mail is sent to
the sales manager.
The BI tools mentioned before do not take an event log as a starting point. The input
is relational data (i.e., one or more tables) or multidimensional data. The core of
most BI tools is an OLAP (Online Analytical Processing) engine driven by tabular
data organized in a so-called OLAP cube. Consider, for example, an OLAP cube
containing sales data. As shown in Fig. 10.1, the dimensions of such a cube may
include product type, region, and quarter. Assume we are interested in the number
of items sold. In this case, the BI product can show the number of products sold
for each cell in the OLAP cube. Suppose that in the fourth quarter (Q4) very few
iPhones were sold in region West. Then one can drill down into this cell. For in-
stance, one can look at individual sales, view the sales per month (refinement of Q4
into October, November, and December), or view the sales per shop (refinement of
the region dimension). When drilling down, the information is refined. Pivoting the