
Page 314 -
P. 314
296 11 Analyzing “Lasagna Processes”
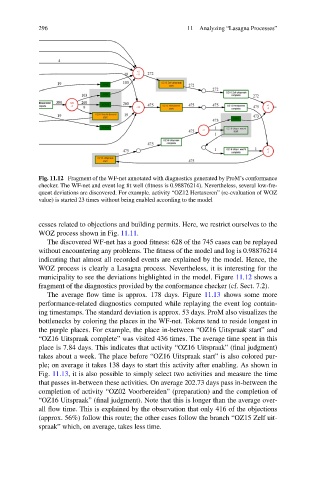
Fig. 11.12 Fragment of the WF-net annotated with diagnostics generated by ProM’s conformance
checker. The WF-net and event log fit well (fitness is 0.98876214). Nevertheless, several low-fre-
quent deviations are discovered. For example. activity “OZ12 Hertaxeren” (re-evaluation of WOZ
value) is started 23 times without being enabled according to the model
cesses related to objections and building permits. Here, we restrict ourselves to the
WOZ process shown in Fig. 11.11.
The discovered WF-net has a good fitness: 628 of the 745 cases can be replayed
without encountering any problems. The fitness of the model and log is 0.98876214
indicating that almost all recorded events are explained by the model. Hence, the
WOZ process is clearly a Lasagna process. Nevertheless, it is interesting for the
municipality to see the deviations highlighted in the model. Figure 11.12 shows a
fragment of the diagnostics provided by the conformance checker (cf. Sect. 7.2).
The average flow time is approx. 178 days. Figure 11.13 shows some more
performance-related diagnostics computed while replaying the event log contain-
ing timestamps. The standard deviation is approx. 53 days. ProM also visualizes the
bottlenecks by coloring the places in the WF-net. Tokens tend to reside longest in
the purple places. For example, the place in-between “OZ16 Uitspraak start” and
“OZ16 Uitspraak complete” was visited 436 times. The average time spent in this
place is 7.84 days. This indicates that activity “OZ16 Uitspraak” (final judgment)
takes about a week. The place before “OZ16 Uitspraak start” is also colored pur-
ple; on average it takes 138 days to start this activity after enabling. As shown in
Fig. 11.13, it is also possible to simply select two activities and measure the time
that passes in-between these activities. On average 202.73 days pass in-between the
completion of activity “OZ02 Voorbereiden” (preparation) and the completion of
“OZ16 Uitspraak” (final judgment). Note that this is longer than the average over-
all flow time. This is explained by the observation that only 416 of the objections
(approx. 56%) follow this route; the other cases follow the branch “OZ15 Zelf uit-
spraak” which, on average, takes less time.