
Page 315 -
P. 315
11.4 Applications 297
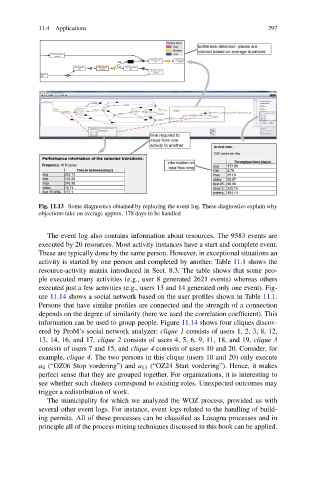
Fig. 11.13 Some diagnostics obtained by replaying the event log. These diagnostics explain why
objections take on average approx. 178 days to be handled
The event log also contains information about resources. The 9583 events are
executed by 20 resources. Most activity instances have a start and complete event.
These are typically done by the same person. However, in exceptional situations an
activity is started by one person and completed by another. Table 11.1 shows the
resource-activity matrix introduced in Sect. 8.3. The table shows that some peo-
ple executed many activities (e.g., user 8 generated 2621 events) whereas others
executed just a few activities (e.g., users 13 and 14 generated only one event). Fig-
ure 11.14 shows a social network based on the user profiles shown in Table 11.1.
Persons that have similar profiles are connected and the strength of a connection
depends on the degree of similarity (here we used the correlation coefficient). This
information can be used to group people. Figure 11.14 shows four cliques discov-
ered by ProM’s social network analyzer: clique 1 consists of users 1, 2, 3, 8, 12,
13, 14, 16, and 17, clique 2 consists of users 4, 5, 6, 9, 11, 18, and 19, clique 3
consists of users 7 and 15, and clique 4 consists of users 10 and 20. Consider, for
example, clique 4. The two persons in this clique (users 10 and 20) only execute
a 4 (“OZ06 Stop vordering”) and a 13 (“OZ24 Start vordering”). Hence, it makes
perfect sense that they are grouped together. For organizations, it is interesting to
see whether such clusters correspond to existing roles. Unexpected outcomes may
trigger a redistribution of work.
The municipality for which we analyzed the WOZ process, provided us with
several other event logs. For instance, event logs related to the handling of build-
ing permits. All of these processes can be classified as Lasagna processes and in
principle all of the process mining techniques discussed in this book can be applied.