
Page 254 - Psychological Management of Individual Performance
P. 254
238 enhancing performance through goal-setting and feedback interventions
CASE STUDY
APROMES FEEDBACK SYSTEM FOR SERVICE TECHNICIANS
We will illustrate our experiences at the hand of one of the cases mentioned earlier, namely
that of field service technicians in a region of a company that supplies and services pho-
tocopiers (Kleingeld, 1994). Each service region is headed by a supervisor and consists
of approximately 20 service technicians, carrying out repairs and maintenance. Table 11.2
shows a feedback report which contains an overview of one technician’s performance in a
one-month period (as well as a six-month average).
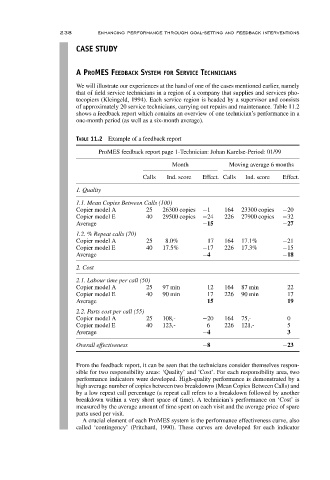
TABLE 11.2 Example of a feedback report
ProMES feedback report page 1-Technician: Johan Karelse-Period: 01/99
Month Moving average 6 months
Calls Ind. score Effect. Calls Ind. score Effect.
1. Quality
1.1. Mean Copies Between Calls (100)
Copier model A 25 26300 copies −1 164 23300 copies −20
Copier model E 40 29500 copies −24 226 27900 copies −32
Average −15 −27
1.2. % Repeat calls (70)
Copier model A 25 8.0% 17 164 17.1% −21
Copier model E 40 17.5% −17 226 17.3% −15
Average −4 −18
2. Cost
2.1. Labour time per call (50)
Copier model A 25 97 min 12 164 87 min 22
Copier model E 40 90 min 17 226 90 min 17
Average 15 19
2.2. Parts cost per call (55)
Copier model A 25 108,- −20 164 75,- 0
Copier model E 40 123,- 6 226 121,- 5
Average −4 3
Overall effectiveness −8 −23
From the feedback report, it can be seen that the technicians consider themselves respon-
sible for two responsibility areas: ‘Quality’ and ‘Cost’. For each responsibility area, two
performance indicators were developed. High-quality performance is demonstrated by a
high average number of copies between two breakdowns (Mean Copies Between Calls) and
by a low repeat call percentage (a repeat call refers to a breakdown followed by another
breakdown within a very short space of time). A technician’s performance on ‘Cost’ is
measured by the average amount of time spent on each visit and the average price of spare
parts used per visit.
A crucial element of each ProMES system is the performance effectiveness curve, also
called ‘contingency’ (Pritchard, 1990). These curves are developed for each indicator