
Page 243 - Radiochemistry and nuclear chemistry
P. 243
Detection and Measurement Techniques 227
This increases the number of events contributing to the photo peak which corresponds to
the total "t-ray energy. Also, if lower energy "t-rays are present their photopeaks may be
obscured by the Compton distribution from higher energy "t-rays. With anthracene crystals
little resolution is seen in "t-spectra as the low atomic number of the absorber makes the
principal interaction the Compton effect. However, in NaI(Tl), CsI(T1), Si(Li), Ge(Li) and
HPGe crystals the photoelectric effect is the more important. Increasing the size of the
crystal increases the probability of photon capture and, therefore, the probability of capture
of the scattered "t-ray in Compton events is increased. As a result, the increase in crystal
size results in more capture of the total incident "t-ray energy which appears under the
photopeaks.
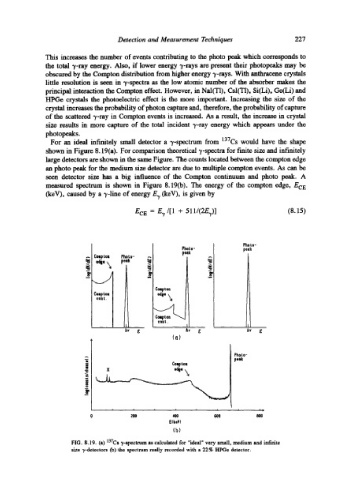
For an ideal infinitely small detector a "t-spectrum from 137Cs would have the shape
shown in Figure 8.19(a). For comparison theoretical "t-spectra for finite size and infinitely
large detectors are shown in the same Figure. The counts located between the compton edge
an photo peak for the medium size detector are due to multiple compton events. As can be
seen detector size has a big influence of the Compton continuum and photo peak. A
measured spectrum is shown in Figure 8.19(b). The energy of the compton edge, EeE
(keV), caused by a "t-line of energy E? (keV), is given by
ECE = E?/[1 + 51 l/(2E?)] (8.15)
Photo- Photo-
peek
i
Compton Photo- peek
Compto.e
5v s 5v E hv s
(a)
Photo-
peek
la Coupton
i
o
Q'I
m
0
r
,.,,.
i i i i i i |, ,
o 2oo 4oo 6o0 Boo
s
(b)
FIG. 8. ] 9. (a) l+TCs ?-spectrum as calculated for "ideal" very small, medium and infinite
size ?-detectors (b) the spectrum really recorded with a 22% HPGe detector.