
Page 16 - Renewable Energy Devices and System with Simulations in MATLAB and ANSYS
P. 16
Renewable Energy Systems: Technology Overview and Perspectives 3
2000
Hydropower Bioenergy
Global renewable capacity (GW) 1200
Geothermal
Wind
1600
Solar
Marine energy
800
400
0
00 01 02 03 04 05 06 07 08 09 10 11 12 13 14
Year (2000– 2014)
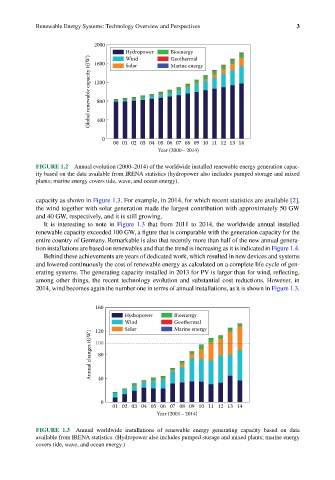
FIGURE 1.2 Annual evolution (2000–2014) of the worldwide installed renewable energy generation capac-
ity based on the data available from IRENA statistics (hydropower also includes pumped storage and mixed
plants; marine energy covers tide, wave, and ocean energy).
capacity as shown in Figure 1.3. For example, in 2014, for which recent statistics are available [2],
the wind together with solar generation made the largest contribution with approximately 50 GW
and 40 GW, respectively, and it is still growing.
It is interesting to note in Figure 1.3 that from 2011 to 2014, the worldwide annual installed
renewable capacity exceeded 100 GW, a figure that is comparable with the generation capacity for the
entire country of Germany. Remarkable is also that recently more than half of the new annual genera-
tion installations are based on renewables and that the trend is increasing as it is indicated in Figure 1.4.
Behind these achievements are years of dedicated work, which resulted in new devices and systems
and lowered continuously the cost of renewable energy as calculated on a complete life cycle of gen-
erating systems. The generating capacity installed in 2013 for PV is larger than for wind, reflecting,
among other things, the recent technology evolution and substantial cost reductions. However, in
2014, wind becomes again the number one in terms of annual installations, as it is shown in Figure 1.3.
160
Hydropower Bioenergy
Wind Geothermal
Solar
Marine energy
120
Annual changes (GW) 100
80
40
0
01 02 03 04 05 06 07 08 09 10 11 12 13 14
Year (2001– 2014)
FIGURE 1.3 Annual worldwide installations of renewable energy generating capacity based on data
available from IRENA statistics. (Hydropower also includes pumped storage and mixed plants; marine energy
covers tide, wave, and ocean energy.)