
Page 329 -
P. 329
318 CHAPTER 11 Analyzing qualitative data
conduct reliability checks frequently so that inconsistent coding can be detected as
early as possible.
One of the commonly used reliability measures is the percentage of agreement
among coders, calculated according to the following equation:
the numberof cases codedthe same waybymultiple coders
%agreement =
t thetotal numberof cases
When analyzing a survey on software and technology for children with autism,
Putnam and Chong (2008) coded the data independently and reported a 94% agree-
ment between the two coders, which is quite a satisfactory level. However, the per-
centage agreement approach does have a limitation: it does not account for the fact
that several coders would agree with each other for a certain percentage of cases even
when they just code the data by chance. Depending on the specific feature of the cod-
ing, that percentage may be quite substantial.
To address this limitation, you can adopt other measures such as Cohen's Kappa
(Cohen, 1960), which rates interrater reliability on a scale from 0 to 1, with 0 mean-
ing that the cases that are coded the same are completely by chance and 1 meaning
perfect reliability. Kappa is calculated by the following equation:
P - P
K = a c
1 - P c
where P a represents the percentage of cases on which the coders agree and P c repre-
sents the percentage of agreed cases when the data is coded by chance.
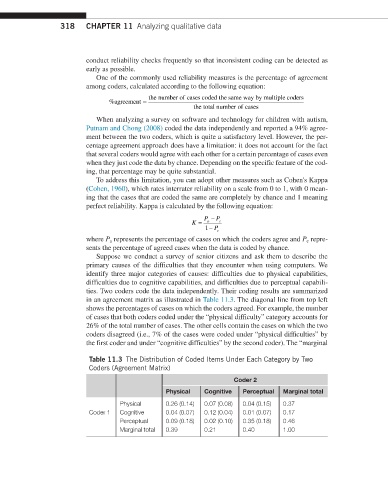
Suppose we conduct a survey of senior citizens and ask them to describe the
primary causes of the difficulties that they encounter when using computers. We
identify three major categories of causes: difficulties due to physical capabilities,
difficulties due to cognitive capabilities, and difficulties due to perceptual capabili-
ties. Two coders code the data independently. Their coding results are summarized
in an agreement matrix as illustrated in Table 11.3. The diagonal line from top left
shows the percentages of cases on which the coders agreed. For example, the number
of cases that both coders coded under the “physical difficulty” category accounts for
26% of the total number of cases. The other cells contain the cases on which the two
coders disagreed (i.e., 7% of the cases were coded under “physical difficulties” by
the first coder and under “cognitive difficulties” by the second coder). The “marginal
Table 11.3 The Distribution of Coded Items Under Each Category by Two
Coders (Agreement Matrix)
Coder 2
Physical Cognitive Perceptual Marginal total
Physical 0.26 (0.14) 0.07 (0.08) 0.04 (0.15) 0.37
Coder 1 Cognitive 0.04 (0.07) 0.12 (0.04) 0.01 (0.07) 0.17
Perceptual 0.09 (0.18) 0.02 (0.10) 0.35 (0.18) 0.46
Marginal total 0.39 0.21 0.40 1.00