
Page 330 -
P. 330
11.4 Analyzing text content 319
totals” are calculated by adding up the values in each row or column. The “marginal
total” values always add up to one. The value in parentheses in each cell represents
the expected percentage agreement when the data is coded by chance, calculated by
multiplying the marginal totals of the corresponding row and column (i.e., the ex-
pected percentage agreement for (physical, physical) is 0.37 × 0.39 = 0.14).
Based on the data provided by Table 11.3, we can compute the value of P a as:
P = 0260 12 0350 73. + . + . = .
a
The value of P c is computed by adding the expected percentage agreement (in
parentheses on the diagonal):
P = 0140 04 018. + . + . = 0 36.
c
Therefore,
0730.
- 36
.
K = = 058
.
- 36.
10
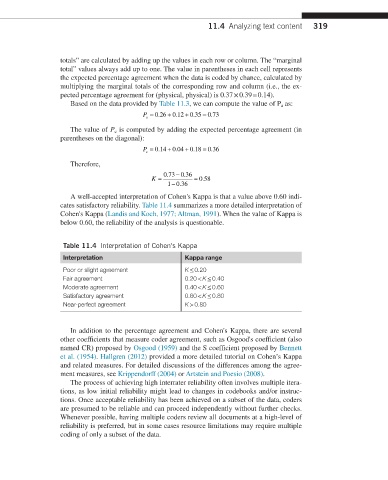
A well-accepted interpretation of Cohen's Kappa is that a value above 0.60 indi-
cates satisfactory reliability. Table 11.4 summarizes a more detailed interpretation of
Cohen's Kappa (Landis and Koch, 1977; Altman, 1991). When the value of Kappa is
below 0.60, the reliability of the analysis is questionable.
Table 11.4 Interpretation of Cohen's Kappa
Interpretation Kappa range
Poor or slight agreement K ≤ 0.20
Fair agreement 0.20 < K ≤ 0.40
Moderate agreement 0.40 < K ≤ 0.60
Satisfactory agreement 0.60 < K ≤ 0.80
Near-perfect agreement K > 0.80
In addition to the percentage agreement and Cohen's Kappa, there are several
other coefficients that measure coder agreement, such as Osgood's coefficient (also
named CR) proposed by Osgood (1959) and the S coefficient proposed by Bennett
et al. (1954). Hallgren (2012) provided a more detailed tutorial on Cohen’s Kappa
and related measures. For detailed discussions of the differences among the agree-
ment measures, see Krippendorff (2004) or Artstein and Poesio (2008).
The process of achieving high interrater reliability often involves multiple itera-
tions, as low initial reliability might lead to changes in codebooks and/or instruc-
tions. Once acceptable reliability has been achieved on a subset of the data, coders
are presumed to be reliable and can proceed independently without further checks.
Whenever possible, having multiple coders review all documents at a high-level of
reliability is preferred, but in some cases resource limitations may require multiple
coding of only a subset of the data.