
Page 252 - Reservoir Formation Damage
P. 252
232 Reservoir Formation Damage
(10-189)
in which
=G' U np= U (10-190)
because all flow goes through the plugging pathways.
The fact that the cumulative amounts of deposits reach certain limiting
values as shown in Figure 10-25 is indicative of attainment of such
equilibrium conditions. Note, however, that the amounts shown in Figure
10-25 are the cumulative amounts including the amount of deposits in
the plugging pathways. Therefore at equilibrium
£ = £ „ + £ (10-191)
//—Constant-Pressure-Difference Tests
Constant pressure tests are more representative of the producing
well conditions.
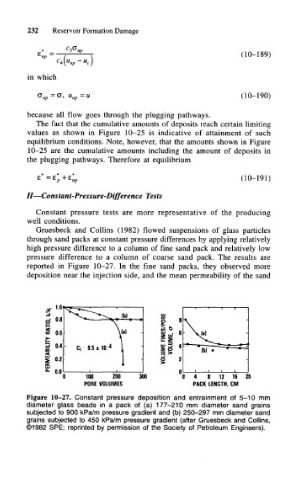
Gruesbeck and Collins (1982) flowed suspensions of glass particles
through sand packs at constant pressure differences by applying relatively
high pressure difference to a column of fine sand pack and relatively low
pressure difference to a column of coarse sand pack. The results are
reported in Figure 10-27. In the fine sand packs, they observed more
deposition near the injection side, and the mean permeability of the sand
1.0
JT
oc
0.8 g
0.6
C|
0.4 • Cj 9.5x10-* J£ ^
IS
i 0.2
g
0.0
100 200 300 4 8 12 16
PORE VOLUMES PACK LENGTH. CM
Figure 10-27. Constant pressure deposition and entrainment of 5-10 mm
diameter glass beads in a pack of (a) 177-210 mm diameter sand grains
subjected to 900 kPa/m pressure gradient and (b) 250-297 mm diameter sand
grains subjected to 450 kPa/m pressure gradient (after Gruesbeck and Collins,
©1982 SPE; reprinted by permission of the Society of Petroleum Engineers).