
Page 249 - Reservoir Formation Damage
P. 249
Single-Phase Formation Damage by Fines Migration and Clay Swelling 229
where
a = 0 when u<u f. (10-188)
where u c is the critical flux below which mobilization does not occur.
Case 2—Particle Deposition in Plugging Pathways. To verify their
plugging rate equation, they considered sand packs and suspension of
glass particles of various sizes. They estimated the effective pore diameter
of the passages between the closest packing of sand grains as the grain
diameter, d g, divided by 6.5, dg/6.5.
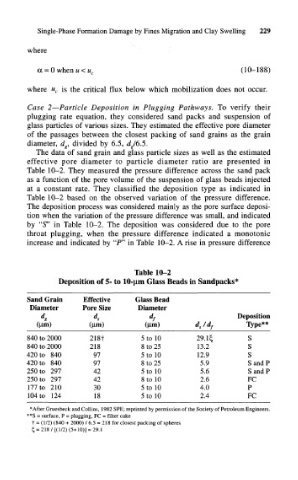
The data of sand grain and glass particle sizes as well as the estimated
effective pore diameter to particle diameter ratio are presented in
Table 10-2. They measured the pressure difference across the sand pack
as a function of the pore volume of the suspension of glass beads injected
at a constant rate. They classified the deposition type as indicated in
Table 10-2 based on the observed variation of the pressure difference.
The deposition process was considered mainly as the pore surface deposi-
tion when the variation of the pressure difference was small, and indicated
by "5"' in Table 10-2. The deposition was considered due to the pore
throat plugging, when the pressure difference indicated a monotonic
increase and indicated by "P" in Table 10-2. A rise in pressure difference
Table 10-2
Deposition of 5- to 10-jo.m Glass Beads in Sandpacks*
Sand Grain Effective Glass Bead
Diameter Pore Size Diameter
Deposition
d g d s d f
(um) (urn) (um) d s/d f Type**
840 to 2000 218f 5 to 10 29.lt, S
840 to 2000 218 8 to 25 13.2 S
420 to 840 97 5 to 10 12.9 S
420 to 840 97 8 to 25 5.9 SandP
250 to 297 42 5 to 10 5.6 SandP
250 to 297 42 8 to 10 2.6 FC
177 to 210 30 5 to 10 4.0 P
104 to 124 18 5 to 10 2.4 FC
* After Gruesbeck and Collins, 1982 SPE; reprinted by permission of the Society of Petroleum Engineers.
**S = surface, P = plugging, FC = filter cake
t = (1/2) (840 + 2000) / 6.5 = 218 for closest packing of spheres
^ = 2187 [(1/2) (5+10)] = 29.1