
Page 286 - Reservoir Formation Damage
P. 286
266 Reservoir Formation Damage
Linear Filter Cake Model
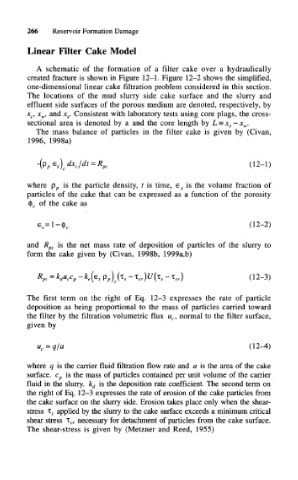
A schematic of the formation of a filter cake over a hydraulically
created fracture is shown in Figure 12-1. Figure 12-2 shows the simplified,
one-dimensional linear cake filtration problem considered in this section.
The locations of the mud slurry side cake surface and the slurry and
effluent side surfaces of the porous medium are denoted, respectively, by
x c, x w, and x e. Consistent with laboratory tests using core plugs, the cross-
sectional area is denoted by a and the core length by L = x e - x w.
The mass balance of particles in the filter cake is given by (Civan,
1996, 1998a)
(12-1)
where p p is the particle density, t is time, e 5 is the volume fraction of
particles of the cake that can be expressed as a function of the porosity
of the cake as
<|> c
(12-2)
e,= l-<t> c
and R ps is the net mass rate of deposition of particles of the slurry to
form the cake given by (Civan, 1998b, 1999a,b)
RPS = k du cc p-k e(e s p,) (T, -t cr)u(i s -T cr ) (12-3)
The first term on the right of Eq. 12-3 expresses the rate of particle
deposition as being proportional to the mass of particles carried toward
the filter by the filtration volumetric flux u c, normal to the filter surface,
given by
u c = q/a (12-4)
where q is the carrier fluid filtration flow rate and a is the area of the cake
surface. c p is the mass of particles contained per unit volume of the carrier
fluid in the slurry. k d is the deposition rate coefficient. The second term on
the right of Eq. 12-3 expresses the rate of erosion of the cake particles from
the cake surface on the slurry side. Erosion takes place only when the shear-
stress i s applied by the slurry to the cake surface exceeds a minimum critical
shear stress i cr necessary for detachment of particles from the cake surface.
The shear-stress is given by (Metzner and Reed, 1955)