
Page 330 - Reservoir Formation Damage
P. 330
310 Reservoir Formation Damage
(text continued from page 306)
particle invasion into an inefficient filter is demonstrated by assuming a
C
value of ( p2i) filer =0.005g/cm 3 in Figures 12-12 through 12-16. Civan's
(1998b) results have similar trends, but different values than the results
of Corapcioglu and Abboud (1990) and Abboud (1993), because of the
simplifying assumptions involved in their calculations, such as incom-
pressible cake and constant cake porosity and the use of the same rates
of deposition for small and all (large plus small) particles over the
progressing cake surface. Also, the average porosity of the filter cake can
vary significantly in actual cases as described by Tien et al. (1997). Next,
Civan (1998b) obtained the numerical solution for the constant pres-
sure drive filtration. Corapcioglu and Abboud (1990) and Abboud (1993)
did not present any results for this case. The flow rate is allowed to
vary according to Eqs. 12-129 and 12-119 for the radial and linear cases,
respectively. In Figures 12-17 through 12-21, Civan's (1998b) results for
the linear and radial cases are compared. The results presented in Figures
12-12 through 12-21 indicate that fine particle invasion into the filter
plays an important role. The differences between the radial and linear
(text continued on page 315)
10 20 30 40 50
Filtration Time, min.
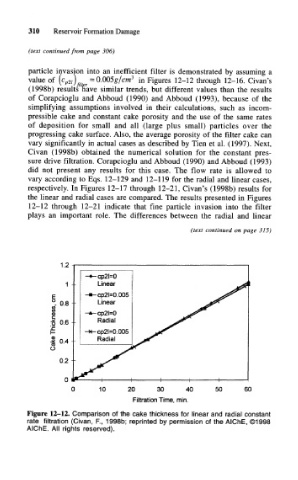
Figure 12-12. Comparison of the cake thickness for linear and radial constant
rate filtration (Civan, R, 1998b; reprinted by permission of the AlChE, ©1998
AlChE. All rights reserved).