
Page 368 - Reservoir Formation Damage
P. 368
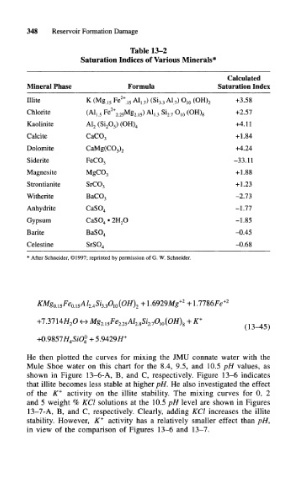
348   Reservoir Formation Damage

                                           Table 13-2
                              Saturation Indices of Various Minerals*


                                                                     Calculated
                Mineral Phase              Formula                 Saturation Index
                Illite         K (Mg  15 Fe 2+  15 Al,  7) (Si 3 3 Al  7) O 10 (OH) 2  +3.58
                Chlorite       (A1 L5 Fe 2+ 2 25Mg 2, 5) A1 L3 Si 2 7 O 10 (OH) 8  +2.57
                Kaolinite      A1 2 (Si 20 5) (OH) 4                   +4.11
                Calcite        CaCO 3                                  +1.84
                Dolomite       CaMg(C0 3) 2                            +4.24
                Siderite       FeCO 3                                  -33.11
                Magnesite      MgC0 3                                  +1.88
                Strontianite   SrCO 3                                  +1.23
                Witherite      BaCO 3                                  -2.73
                Anhydrite      CaSO 4                                  -1.77
                Gypsum         CaSO 4 • 2H 2O                          -1.85
                Barite         BaSO 4                                  -0.45
                Celestine      SrSO 4                                  -0.68
                * After  Schneider, ©1997; reprinted by permission of G. W. Schneider.


                                              + l.6929Mg +2  +
                  KMg OA5Fe OA5Al 24Si 33O w(OH) 2
                  +7.3714// 20 ^ Mg 2A5Fe 2. 25A/ 2. 8 S/ 2. 70 10(0//) 8 + K +
                                                                          (13-45)
                  +0.9857/f 4S*0 4° +5.9429// +

                He  then  plotted  the  curves  for  mixing  the  JMU  connate  water  with  the
                Mule  Shoe  water  on  this  chart  for  the  8.4, 9.5, and  10.5 pH  values,  as
                shown  in  Figure  13-6-A,  B,  and  C,  respectively.  Figure  13-6  indicates
                that illite becomes  less  stable  at higher pH.  He  also  investigated  the  effect
                of  the  K +  activity  on  the  illite  stability.  The  mixing  curves  for  0,  2
                and  5 weight  % KCl  solutions  at the  10.5 pH  level  are  shown  in  Figures
                13-7-A,  B,  and  C,  respectively.  Clearly,  adding  KCl  increases  the  illite
                stability.  However,  K +  activity  has  a  relatively  smaller  effect  than  pH,
                in  view  of  the  comparison  of  Figures  13-6  and  13-7.