
Page 191 - Reservoir Geomechanics
P. 191
173 Compressive and tensile failures in vertical wells
a.
160
140 s qq
120
Stress at wellbore wall (MPa) 100 s zz
80
60
40
20
s rr
0
0 90 180 270 360
Angle around the hole (from south)
b. c.
o
Mohr diagram at 0 , 180 o
80
Shear stress (MPa) 40 W BO
60
20
s zz
s rr s qq
0
−20 0 20 40 60 80 100 120 140 160 South
Effective stress (MPa)
0 50 100 150
Required C 0
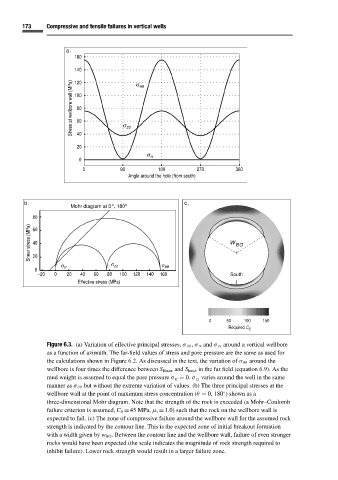
Figure 6.3. (a) Variation of effective principal stresses, σ θθ , σ rr and σ zz around a vertical wellbore
as a function of azimuth. The far-field values of stress and pore pressure are the same as used for
the calculations shown in Figure 6.2.As discussed in the text, the variation of σ θθ around the
wellbore is four times the difference between S Hmax and S hmin in the far field (equation 6.9). As the
mud weight is assumed to equal the pore pressure σ rr = 0. σ zz varies around the well in the same
manner as σ θθ but without the extreme variation of values. (b) The three principal stresses at the
wellbore wall at the point of maximum stress concentration (θ = 0, 180 ) shown as a
◦
three-dimensional Mohr diagram. Note that the strength of the rock is exceeded (a Mohr–Coulomb
failure criterion is assumed, C 0 = 45 MPa, µ i = 1.0) such that the rock on the wellbore wall is
expected to fail. (c) The zone of compressive failure around the wellbore wall for the assumed rock
strength is indicated by the contour line. This is the expected zone of initial breakout formation
with a width given by w BO . Between the contour line and the wellbore wall, failure of even stronger
rocks would have been expected (the scale indicates the magnitude of rock strength required to
inhibit failure). Lower rock strength would result in a larger failure zone.