
Page 232 - Reservoir Geomechanics
P. 232
a.
2500 2
Shut-in
Shut-in
2000
1.5
Surface pressure (psi) 1500 Pressure 1 Flowrate (bbl/min)
1000
Shut-in Shut-in
0.5
500 Flowrate 10 bbls 15 bbls
0 0
0:00 15:00 30:00 45:00 60:00 75:00 90:00 105:00 120:00 135:00
Elapsed time (min)
b. First cycle First cycle
2050 2050
2000 2000
ISIP
1950 1950 Closure pressure
Surface pressure (psi) 1900 1900
1850
1850
1800 1800
1750 1750
1700 1700
0 5 10 15 20 25 30 0 1 2 3 4 5 6 7 8
Time after shut in time (min)
Second cycle Second cycle
2050 2050
2000
2000
1950 ISIP 1950
Surface pressure (psi) 1900 1900
1850
1850
1800 Closure pressure
1800
1750
1700 1750
0 5 10 15 20 25 30 0 1 2 3 4 5 6 7 8
Time after shut in time (min)
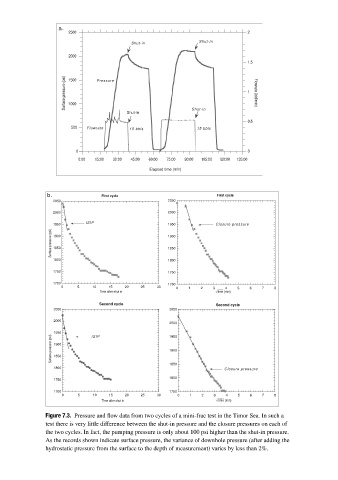
Figure 7.3. Pressure and flow data from two cycles of a mini-frac test in the Timor Sea. In such a
test there is very little difference between the shut-in pressure and the closure pressures on each of
the two cycles. In fact, the pumping pressure is only about 100 psi higher than the shut-in pressure.
As the records shown indicate surface pressure, the variance of downhole pressure (after adding the
hydrostatic pressure from the surface to the depth of measurement) varies by less than 2%.