
Page 251 - Reservoir Geomechanics
P. 251
232 Reservoir geomechanics
Breakout azimuth
0 90 180 270 360
5390
Ultrasonic televiewer data
5394
5395
5396
5395
5397
Depth (meters) 5398
5399
5400
5400
5401
5402
5403
5404 5405
−60 −40 −20 0 20 40 60
o
Temperature gradient ( C/km)
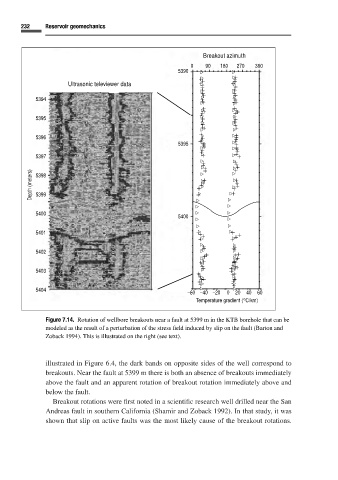
Figure 7.14. Rotation of wellbore breakouts near a fault at 5399 m in the KTB borehole that can be
modeled as the result of a perturbation of the stress field induced by slip on the fault (Barton and
Zoback 1994). This is illustrated on the right (see text).
illustrated in Figure 6.4, the dark bands on opposite sides of the well correspond to
breakouts. Near the fault at 5399 m there is both an absence of breakouts immediately
above the fault and an apparent rotation of breakout rotation immediately above and
below the fault.
Breakout rotations were first noted in a scientific research well drilled near the San
Andreas fault in southern California (Shamir and Zoback 1992). In that study, it was
shown that slip on active faults was the most likely cause of the breakout rotations.