
Page 37 - Reservoir Geomechanics
P. 37
21 The tectonic stress field
121 o 120 o 119 o
Coalinga
Coalinga
36 o Kettleman Hills 36 o
South Belridge
SAN JOAQUINVALLEY
San Luis
San Andreas Fault
Obispo
Bakersfield
Rio Viejo
Santa Pleito White Wolf Fault
35 o Pacific Maria 35 o
Carizzo Plain
Ocean
1952 Kern Co. Eq.
20 km
121 o 120 o 119 o
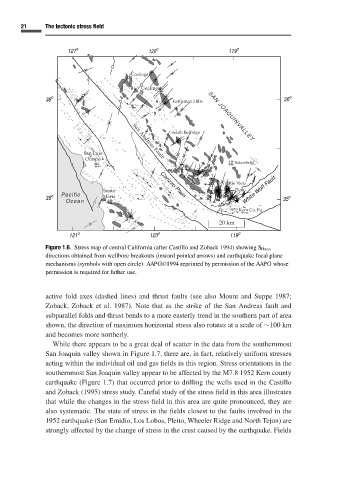
Figure 1.6. Stress map of central California (after Castillo and Zoback 1994) showing S Hmax
directions obtained from wellbore breakouts (inward pointed arrows) and earthquake focal plane
mechanisms (symbols with open circle). AAPG C 1994 reprinted by permission of the AAPG whose
permission is required for futher use.
active fold axes (dashed lines) and thrust faults (see also Mount and Suppe 1987;
Zoback, Zoback et al. 1987). Note that as the strike of the San Andreas fault and
subparallel folds and thrust bends to a more easterly trend in the southern part of area
shown, the direction of maximum horizontal stress also rotates at a scale of ∼100 km
and becomes more northerly.
While there appears to be a great deal of scatter in the data from the southernmost
San Joaquin valley shown in Figure 1.7, there are, in fact, relatively uniform stresses
acting within the individual oil and gas fields in this region. Stress orientations in the
southernmost San Joaquin valley appear to be affected by the M7.8 1952 Kern county
earthquake (Figure 1.7) that occurred prior to drilling the wells used in the Castillo
and Zoback (1995) stress study. Careful study of the stress field in this area illustrates
that while the changes in the stress field in this area are quite pronounced, they are
also systematic. The state of stress in the fields closest to the faults involved in the
1952 earthquake (San Emidio, Los Lobos, Pleito, Wheeler Ridge and North Tejon) are
strongly affected by the change of stress in the crust caused by the earthquake. Fields