
Page 34 - Reservoir Geomechanics
P. 34
North faulting stress
2 ˚ 4 2 3 ˚ 8 8 2 ˚ 2 5 ˚ 4 6 ˚ 8 4 ˚ 2 3 ˚ 6 1 ˚ 4 2 3 ˚ 8 8 2 ˚ 2 5 2 base data Map Stress World the from America B and A Only (1991). Zoback and Zoback after bathymetry and topography faulting reverse green, in shown are areas strike-slip red, in shown are black. in shown are magnitudes
(S Hmax )in on normal relative
stress superimposed of unknown
horizontal characteristic with
˚ ˚
6 6
1 1
2 2
maximum points indicators
U of Data and
.
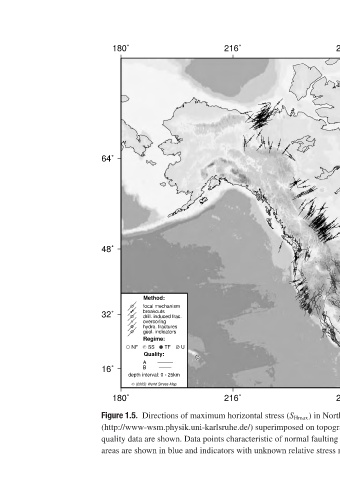
m c m (http://www-wsm.physik.uni-karlsruhe.de/)
s a r s s k p a blue
i f e r r 5
n o M shown.
a d u t t F 2 s
: h s e c g c a c : T : - s e
d c e t u u n i r a r f i d e y 0 : r t S Directions in
o m o d o . n i m t i l
h l k n i c o . i l a d l r
t a a . l r r l g S a v r o
e c e l i e d o e S u e W are
M o r r v y e R Q A B t ) shown
o
h
g
d
b
f
i n 5
0
h t 0 2
F p ( data
N e 1.5.
˚ d ˚ are
0 0
8 8
1 1 quality
˚ ˚ ˚ ˚ Figure
4 8 2 6 areas
6 4 3 1