
Page 157 - Rock Mechanics For Underground Mining
P. 157
PROBLEMS
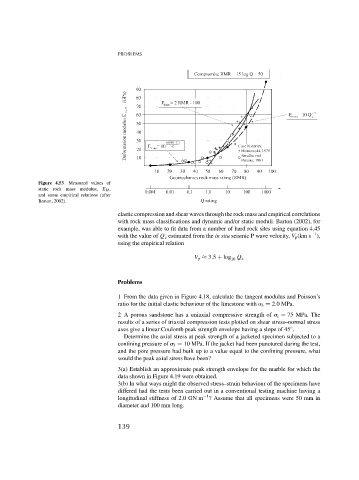
Figure 4.53 Measured values of
static rock mass modulus, E M ,
and some empirical relations (after
Barton, 2002).
elastic compression and shear waves through the rock mass and empirical correlations
with rock mass classifications and dynamic and/or static moduli. Barton (2002), for
example, was able to fit data from a number of hard rock sites using equation 4.45
−1
with the value of Q c estimated from the in situ seismic P wave velocity, V p (km s ),
using the empirical relation
V p ≈ 3.5 + log Q c
10
Problems
1 From the data given in Figure 4.18, calculate the tangent modulus and Poisson’s
ratio for the initial elastic behaviour of the limestone with 3 = 2.0MPa.
2 A porous sandstone has a uniaxial compressive strength of c = 75 MPa. The
results of a series of triaxial compression tests plotted on shear stress–normal stress
◦
axes give a linear Coulomb peak strength envelope having a slope of 45 .
Determine the axial stress at peak strength of a jacketed specimen subjected to a
confining pressure of 3 = 10 MPa. If the jacket had been punctured during the test,
and the pore pressure had built up to a value equal to the confining pressure, what
would the peak axial stress have been?
3(a) Establish an approximate peak strength envelope for the marble for which the
data shown in Figure 4.19 were obtained.
3(b) In what ways might the observed stress–strain behaviour of the specimens have
differed had the tests been carried out in a conventional testing machine having a
−1
longitudinal stiffness of 2.0GN m ? Assume that all specimens were 50 mm in
diameter and 100 mm long.
139