
Page 162 - Rock Mechanics For Underground Mining
P. 162
PRE-MINING STATE OF STRESS
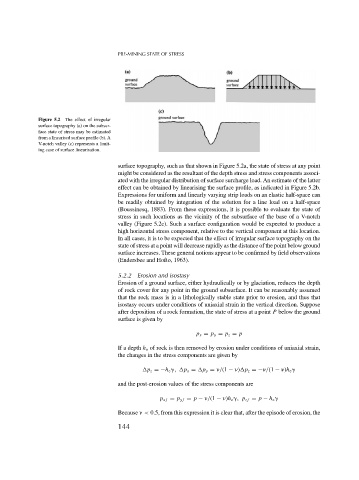
Figure 5.2 The effect of irregular
surface topography (a) on the subsur-
face state of stress may be estimated
from a linearised surface profile (b). A
V-notch valley (c) represents a limit-
ing case of surface linearisation.
surface topography, such as that shown in Figure 5.2a, the state of stress at any point
might be considered as the resultant of the depth stress and stress components associ-
ated with the irregular distribution of surface surcharge load. An estimate of the latter
effect can be obtained by linearising the surface profile, as indicated in Figure 5.2b.
Expressions for uniform and linearly varying strip loads on an elastic half-space can
be readily obtained by integration of the solution for a line load on a half-space
(Boussinesq, 1883). From these expressions, it is possible to evaluate the state of
stress in such locations as the vicinity of the subsurface of the base of a V-notch
valley (Figure 5.2c). Such a surface configuration would be expected to produce a
high horizontal stress component, relative to the vertical component at this location.
In all cases, it is to be expected that the effect of irregular surface topography on the
state of stress at a point will decrease rapidly as the distance of the point below ground
surface increases. These general notions appear to be confirmed by field observations
(Endersbee and Hofto, 1963).
5.2.2 Erosion and isostasy
Erosion of a ground surface, either hydraulically or by glaciation, reduces the depth
of rock cover for any point in the ground subsurface. It can be reasonably assumed
that the rock mass is in a lithologically stable state prior to erosion, and thus that
isostasy occurs under conditions of uniaxial strain in the vertical direction. Suppose
after deposition of a rock formation, the state of stress at a point P below the ground
surface is given by
p x = p y = p z = p
If a depth h e of rock is then removed by erosion under conditions of uniaxial strain,
the changes in the stress components are given by
p z =−h e , p x = p y = /(1 − ) p z =− /(1 − )h e
and the post-erosion values of the stress components are
p xf = p yf = p − /(1 − )h e , p zf = p − h e
Because < 0.5, from this expression it is clear that, after the episode of erosion, the
144