
Page 234 - Rock Mechanics For Underground Mining
P. 234
EXCAVATION DESIGN IN MASSIVE ELASTIC ROCK
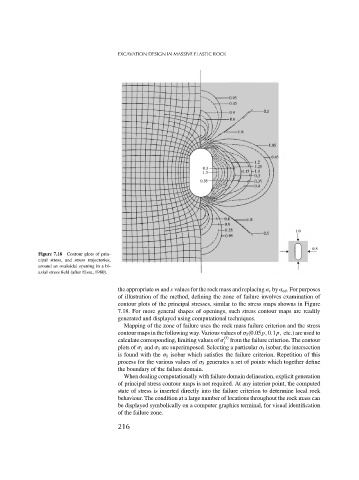
Figure 7.18 Contour plots of prin-
cipal stress, and stress trajectories,
around an ovaloidal opening in a bi-
axial stress field (after Eissa, 1980).
the appropriate m and s values for the rock mass and replacing c by cd . For purposes
of illustration of the method, defining the zone of failure involves examination of
contour plots of the principal stresses, similar to the stress maps showns in Figure
7.18. For more general shapes of openings, such stress contour maps are readily
generated and displayed using computational techniques.
Mapping of the zone of failure uses the rock mass failure criterion and the stress
contour maps in the following way. Various values of 3 (0.05p, 0.1p, etc.) are used to
(f)
calculate corresponding, limiting values of from the failure criterion. The contour
1
plots of 1 and 3 are superimposed. Selecting a particular 3 isobar, the intersection
is found with the 1 isobar which satisfies the failure criterion. Repetition of this
process for the various values of 3 generates a set of points which together define
the boundary of the failure domain.
When dealing computationally with failure domain delineation, explicit generation
of principal stress contour maps is not required. At any interior point, the computed
state of stress is inserted directly into the failure criterion to determine local rock
behaviour. The condition at a large number of locations throughout the rock mass can
be displayed symbolically on a computer graphics terminal, for visual identification
of the failure zone.
216