Page 429 - Rock Mechanics For Underground Mining
P. 429

BACKFILL PROPERTIES AND PLACEMENT

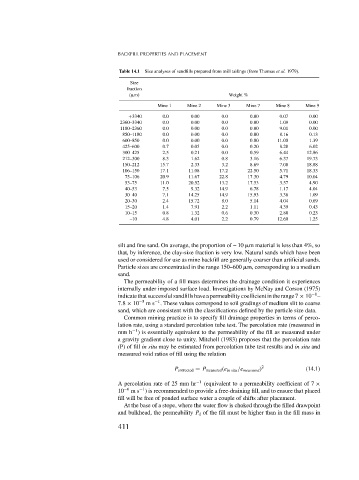
                                        Table 14.1  Size analyses of sandfills prepared from mill tailings (from Thomas et al. 1979).

                                            Size
                                           fraction
                                            (
m)                             Weight %
                                                     Mine 1    Mine 2    Mine 3    Mine 7   Mine 8    Mine 9

                                            +3340      0.0      0.00      0.0       0.00      0.07     0.00
                                         2360–3340     0.0      0.00      0.0       0.00      1.09     0.00
                                         1180–2360     0.0      0.00      0.0       0.00      9.01     0.00
                                          850–1180     0.0      0.00      0.0       0.00      8.16     0.13
                                          600–850      0.0      0.00      0.0       0.00     11.00     1.39
                                          425–600      0.7      0.05      0.0       0.20      8.28     6.02
                                          300–425      2.5      0.21      0.0       0.59      6.44     12.86
                                          212–300      8.3      1.62      0.8       3.16      6.37     19.73
                                          150–212     15.7      2.33      3.2       8.69      7.08     18.88
                                          106–150     17.1     11.08      17.2     22.50      5.71     18.33
                                          75–106      20.9     11.67      22.8     17.30      4.79     10.04
                                          53–75       11.0     20.52      13.2     17.53      3.57     4.90
                                          40–53        7.5      9.32      14.9      6.78      1.17     4.04
                                          30–40        7.1     14.25      14.9     15.93      3.36     1.09
                                          20–30        2.4     15.72      8.0       5.14      4.04     0.69
                                          15–20        1.4      7.91      2.2       1.11      4.39     0.43
                                          10–15        0.8      1.32      0.6       0.30      2.88     0.23
                                            –10        4.8      4.01      2.2       0.79     12.60     1.25


                                        silt and fine sand. On average, the proportion of – 10 
m material is less than 4%, so
                                        that, by inference, the clay-size fraction is very low. Natural sands which have been
                                        used or considered for use as mine backfill are generally coarser than artificial sands.
                                        Particle sizes are concentrated in the range 150–600 
m, corresponding to a medium
                                        sand.
                                          The permeability of a fill mass determines the drainage condition it experiences
                                        internally under imposed surface load. Investigations by McNay and Corson (1975)
                                                                                                        −8
                                        indicatethatsuccessfulsandfillshaveapermeabilitycoefficientintherange7 × 10 –
                                                    −1
                                        7.8 × 10 −5  ms . These values correspond to soil gradings of medium slit to coarse
                                        sand, which are consistent with the classifications defined by the particle size data.
                                          Common mining practice is to specify fill drainage properties in terms of perco-
                                        lation rate, using a standard percolation tube test. The percolation rate (measured in
                                             −1
                                        mm h ) is essentially equivalent to the permeability of the fill as measured under
                                        a gravity gradient close to unity. Mitchell (1983) proposes that the percolation rate
                                        (P) of fill in situ may be estimated from percolation tube test results and in situ and
                                        measured void ratios of fill using the relation


                                                           P corrected = P measured (e in situ /e measured ) 2  (14.1)

                                        A percolation rate of 25 mm hr −1  (equivalent to a permeability coefficient of 7 ×
                                               −1
                                        10 −6  ms ) is recommended to provide a free-draining fill, and to ensure that placed
                                        fill will be free of ponded surface water a couple of shifts after placement.
                                          At the base of a stope, where the water flow is choked through the filled drawpoint
                                        and bulkhead, the permeability P d of the fill must be higher than in the fill mass in
                                        411
   424   425   426   427   428   429   430   431   432   433   434