
Page 488 - Rock Mechanics For Underground Mining
P. 488
LONGWALL AND CAVING MINING METHODS
can arise as to whether or not the minimum dimension (or width) of an elongated
undercut can control cavability, irrespective of the value of the hydraulic radius. Data
collected by Mawdesley (2002) suggest that the hydraulic radius (or shape factor) is
a satisfactory predictor of stability or cavability for aspect ratios of less than about
three. It should be noted, however, that the hydraulic radius is calculated from the plan
dimensions of the undercut level. It does not permit account to be taken of the curved
or arched profile of an arrested cave such as that which developed at Northparkes.
Since the 1980s, Laubscher’s caving chart has been the major method used interna-
tionally to predict cavability in block and panel caving mines. It has been particularly
successful when applied to the weaker and larger orebodies for which it was first
developed. However, recent experience suggests that it may not always provide satis-
factory results for stronger, smaller and isolated or constrained blocks or orebodies.
There may be insufficient case studies available, especially for rock masses having
MRMR values of more than 50, to enable the three zones of stability to be delineated
with a reasonable degree of accuracy over a wide range of conditions. This is not an
unusual occurrence when an attempt is made to extend an empirical method outside
the limits of the experience for which it was first developed.
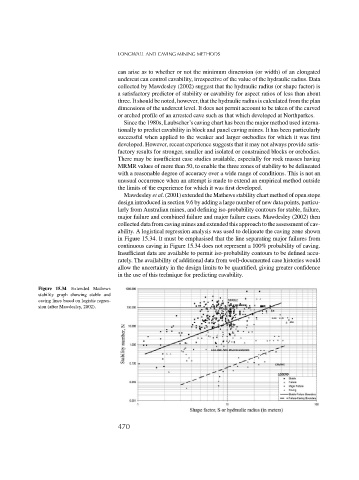
Mawdesley et al. (2001) extended the Mathews stability chart method of open stope
design introduced in section 9.6 by adding a large number of new data points, particu-
larly from Australian mines, and defining iso-probability contours for stable, failure,
major failure and combined failure and major failure cases. Mawdesley (2002) then
collected data from caving mines and extended this approach to the assessment of cav-
ability. A logistical regression analysis was used to delineate the caving zone shown
in Figure 15.34. It must be emphasised that the line separating major failures from
continuous caving in Figure 15.34 does not represent a 100% probability of caving.
Insufficient data are available to permit iso-probability contours to be defined accu-
rately. The availability of additional data from well-documented case histories would
allow the uncertainty in the design limits to be quantified, giving greater confidence
in the use of this technique for predicting cavability.
Figure 15.34 Extended Mathews
stability graph showing stable and
caving lines based on logistic regres-
sion (after Mawdesley, 2002).
470